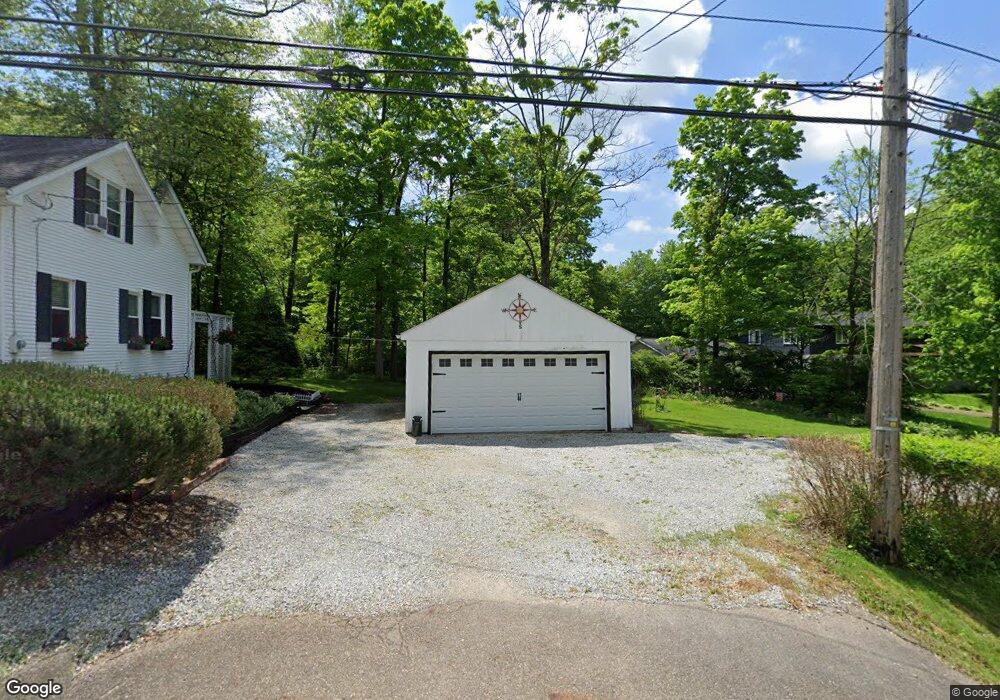
1104 W Nimisila Rd New Franklin, OH 44216
Estimated Value: $110,000 - $197,000
3
Beds
1
Bath
648
Sq Ft
$230/Sq Ft
Est. Value
About This Home
This home is located at 1104 W Nimisila Rd, New Franklin, OH 44216 and is currently estimated at $149,016, approximately $229 per square foot. 1104 W Nimisila Rd is a home located in Summit County with nearby schools including St. Francis de Sales School and SS Philip and James Elementary.
Ownership History
Date
Name
Owned For
Owner Type
Purchase Details
Closed on
Jun 11, 2021
Sold by
Joseph David
Bought by
Joseph Drew M and Joseph Dylan M
Current Estimated Value
Purchase Details
Closed on
Nov 20, 2000
Sold by
Stone John L and Vance Marjorie A
Bought by
Joseph David and Joseph Donna M
Home Financials for this Owner
Home Financials are based on the most recent Mortgage that was taken out on this home.
Original Mortgage
$40,000
Interest Rate
7.87%
Purchase Details
Closed on
Apr 20, 1994
Sold by
Stone Estelle A
Bought by
Stone John L and Vance Marjorie A
Purchase Details
Closed on
May 7, 1993
Sold by
Stone John L
Bought by
Stone Estelle A
Create a Home Valuation Report for This Property
The Home Valuation Report is an in-depth analysis detailing your home's value as well as a comparison with similar homes in the area
Home Values in the Area
Average Home Value in this Area
Purchase History
| Date | Buyer | Sale Price | Title Company |
|---|---|---|---|
| Joseph Drew M | -- | -- | |
| Joseph David | $50,000 | Gateway Title Agency Inc | |
| Stone John L | -- | Gateway Title Agency Inc | |
| Stone John L | -- | Gateway Title Agency Inc | |
| Stone Estelle A | -- | Gateway Title Agency Inc |
Source: Public Records
Mortgage History
| Date | Status | Borrower | Loan Amount |
|---|---|---|---|
| Previous Owner | Joseph David | $40,000 |
Source: Public Records
Tax History Compared to Growth
Tax History
| Year | Tax Paid | Tax Assessment Tax Assessment Total Assessment is a certain percentage of the fair market value that is determined by local assessors to be the total taxable value of land and additions on the property. | Land | Improvement |
|---|---|---|---|---|
| 2025 | $1,371 | $35,970 | $6,811 | $29,159 |
| 2024 | $1,371 | $35,970 | $6,811 | $29,159 |
| 2023 | $1,371 | $35,970 | $6,811 | $29,159 |
| 2022 | $1,226 | $27,336 | $5,086 | $22,250 |
| 2021 | $1,230 | $27,336 | $5,086 | $22,250 |
| 2020 | $1,209 | $27,340 | $5,090 | $22,250 |
| 2019 | $1,092 | $23,750 | $6,260 | $17,490 |
| 2018 | $945 | $23,750 | $6,260 | $17,490 |
| 2017 | $832 | $23,750 | $6,260 | $17,490 |
| 2016 | $827 | $20,730 | $6,260 | $14,470 |
| 2015 | $832 | $20,730 | $6,260 | $14,470 |
| 2014 | $827 | $20,730 | $6,260 | $14,470 |
| 2013 | -- | $21,550 | $6,260 | $15,290 |
Source: Public Records
Map
Nearby Homes
- 6387 Hampsher Rd
- 6090 Manchester Rd Unit 6096
- 1062 Stump Rd
- 781 Leeman Dr
- 715 Highland Park Dr
- 6407 Southview Dr
- 451 Yager Rd
- 5983 Weaver Rd
- 0 W Comet Rd Unit 5079117
- 7060 Manchester Rd
- 427 Center Rd
- 8714 Greenmeadow Ave NW
- 0 Babst Ave NW
- 11391 Michelle Dr NW
- 2200 W Comet Rd
- S/L 14,15 Shakes Hotel Dr
- 4851 Manchester Rd
- 765 Longview Ave
- 8257 Akron Ave NW
- 6 Shrakes Hotel Dr
- 1109 W Nimisila Rd
- 1116 W Nimisila Rd
- 1117 W Nimisila Rd
- 1082 W Nimisila Rd
- 1090 W Nimisila Rd
- 1072 W Nimisila Rd
- 1087 W Nimisila Rd
- 1069 W Nimisila Rd
- 1058 W Nimisila Rd
- 1059 W Nimisila Rd
- 1130 W Nimisila Rd
- 1131 W Nimisila Rd
- 1045 W Nimisila Rd
- 1126 W Nimisila Rd
- 1166 W Nimisila Rd
- 1027 W Nimisila Rd
- 1189 W Nimisila Rd
- 1015 W Nimisila Rd
- 1016 W Nimisila Rd
- 1066 W Nimisila Rd