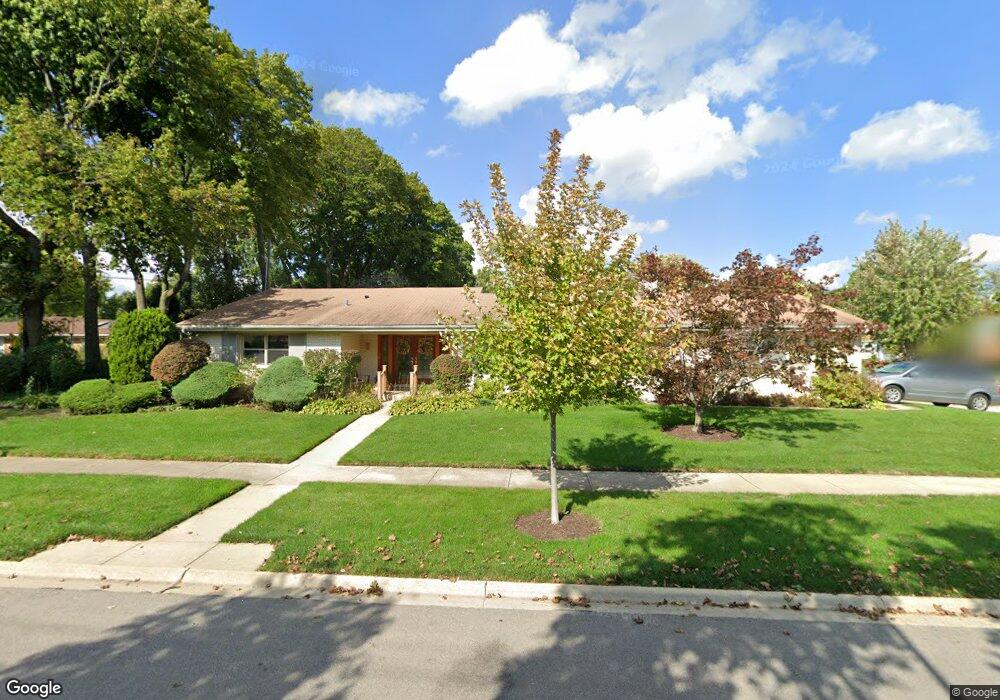
1104 W Sigwalt St Arlington Heights, IL 60005
Estimated Value: $534,000 - $609,000
4
Beds
3
Baths
1,998
Sq Ft
$293/Sq Ft
Est. Value
About This Home
This home is located at 1104 W Sigwalt St, Arlington Heights, IL 60005 and is currently estimated at $586,115, approximately $293 per square foot. 1104 W Sigwalt St is a home located in Cook County with nearby schools including Westgate Elementary School, South Middle School, and Rolling Meadows High School.
Ownership History
Date
Name
Owned For
Owner Type
Purchase Details
Closed on
Dec 4, 2000
Sold by
Mcqueeney Henry John and Woomer Mcqueeney Tami J
Bought by
Declaratio Pfleger Kathleen C and Kathleen C Pfleeger Declaration Of Trust
Current Estimated Value
Home Financials for this Owner
Home Financials are based on the most recent Mortgage that was taken out on this home.
Original Mortgage
$225,000
Outstanding Balance
$81,720
Interest Rate
7.5%
Estimated Equity
$504,395
Purchase Details
Closed on
Jun 14, 1996
Sold by
Moser Marian J
Bought by
Mcqueeney Henry John and Wooser Mcqueeney Tami J
Home Financials for this Owner
Home Financials are based on the most recent Mortgage that was taken out on this home.
Original Mortgage
$207,000
Interest Rate
8.29%
Mortgage Type
Balloon
Create a Home Valuation Report for This Property
The Home Valuation Report is an in-depth analysis detailing your home's value as well as a comparison with similar homes in the area
Home Values in the Area
Average Home Value in this Area
Purchase History
| Date | Buyer | Sale Price | Title Company |
|---|---|---|---|
| Declaratio Pfleger Kathleen C | $325,000 | -- | |
| Mcqueeney Henry John | $239,000 | -- |
Source: Public Records
Mortgage History
| Date | Status | Borrower | Loan Amount |
|---|---|---|---|
| Open | Declaratio Pfleger Kathleen C | $225,000 | |
| Previous Owner | Mcqueeney Henry John | $207,000 |
Source: Public Records
Tax History Compared to Growth
Tax History
| Year | Tax Paid | Tax Assessment Tax Assessment Total Assessment is a certain percentage of the fair market value that is determined by local assessors to be the total taxable value of land and additions on the property. | Land | Improvement |
|---|---|---|---|---|
| 2024 | $9,765 | $41,637 | $10,368 | $31,269 |
| 2023 | $9,813 | $41,637 | $10,368 | $31,269 |
| 2022 | $9,813 | $43,375 | $10,368 | $33,007 |
| 2021 | $6,640 | $28,054 | $6,480 | $21,574 |
| 2020 | $6,589 | $28,054 | $6,480 | $21,574 |
| 2019 | $6,564 | $31,172 | $6,480 | $24,692 |
| 2018 | $6,559 | $28,659 | $5,702 | $22,957 |
| 2017 | $6,513 | $28,659 | $5,702 | $22,957 |
| 2016 | $7,368 | $31,676 | $5,702 | $25,974 |
| 2015 | $6,934 | $27,981 | $4,924 | $23,057 |
| 2014 | $6,759 | $27,981 | $4,924 | $23,057 |
| 2013 | $6,559 | $27,981 | $4,924 | $23,057 |
Source: Public Records
Map
Nearby Homes
- 24 S Kaspar Ave
- 12 S Princeton Ct
- 222 S Dwyer Ave
- 1419 W Miner St
- 34 N Reuter Dr
- 1418 W Saint James Place
- 1615 W Johanna Terrace
- 316 S Reuter Dr
- 514 W Miner St Unit 2F
- 105 S Mitchell Ave
- 318 W Wing St
- 314 W Wing St
- 502 S Reuter Dr
- 151 W Wing St Unit 301
- 1 S Highland Ave Unit 800
- 1 S Highland Ave Unit 400
- 617 N Wilke Rd
- 105 S Vail Ave
- 121 S Vail Ave Unit 403
- 121 S Vail Ave Unit 401
- 24 S Patton Ave
- 1114 W Sigwalt St
- 1105 W Sigwalt St
- 25 S Dwyer Ave
- 20 S Patton Ave
- 101 S Dwyer Ave
- 1014 W Sigwalt St
- 108 S Patton Ave
- 21 S Dwyer Ave
- 27 S Patton Ave
- 10 S Patton Ave
- 1015 W Sigwalt St
- 21 S Patton Ave
- 112 S Patton Ave
- 15 S Dwyer Ave
- 107 S Patton Ave
- 15 S Patton Ave
- 1202 W Sigwalt St Unit A
- 111 S Dwyer Ave
- 2 S Patton Ave