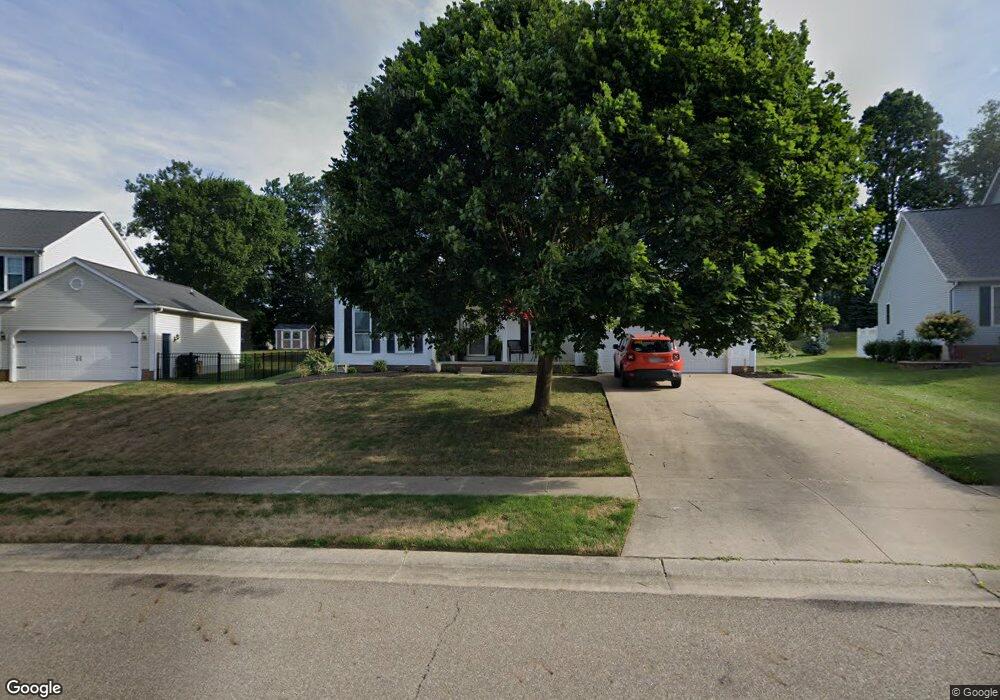
11040 Thoresby Cir NW Uniontown, OH 44685
Estimated Value: $326,210 - $378,000
4
Beds
3
Baths
1,826
Sq Ft
$197/Sq Ft
Est. Value
About This Home
This home is located at 11040 Thoresby Cir NW, Uniontown, OH 44685 and is currently estimated at $360,553, approximately $197 per square foot. 11040 Thoresby Cir NW is a home located in Stark County with nearby schools including North Canton Middle School, Hoover High School, and Lake Center Christian School.
Ownership History
Date
Name
Owned For
Owner Type
Purchase Details
Closed on
Sep 26, 2003
Sold by
Wolicki Matthew J and Wolicki Alecia D
Bought by
Horton David B and Horton Diana J
Current Estimated Value
Home Financials for this Owner
Home Financials are based on the most recent Mortgage that was taken out on this home.
Original Mortgage
$151,920
Outstanding Balance
$71,478
Interest Rate
6.33%
Mortgage Type
Purchase Money Mortgage
Estimated Equity
$289,075
Purchase Details
Closed on
Apr 21, 2003
Sold by
Weirtz Paul L and Weirtz Mary C
Bought by
Wolicki Matthew J and Wolicki Alecia D
Home Financials for this Owner
Home Financials are based on the most recent Mortgage that was taken out on this home.
Original Mortgage
$171,900
Interest Rate
5.76%
Mortgage Type
Purchase Money Mortgage
Purchase Details
Closed on
Oct 3, 1996
Sold by
Chatham Dev Corp
Bought by
Elson J Hershberger Const
Home Financials for this Owner
Home Financials are based on the most recent Mortgage that was taken out on this home.
Original Mortgage
$1,000,000
Interest Rate
8%
Mortgage Type
New Conventional
Create a Home Valuation Report for This Property
The Home Valuation Report is an in-depth analysis detailing your home's value as well as a comparison with similar homes in the area
Home Values in the Area
Average Home Value in this Area
Purchase History
| Date | Buyer | Sale Price | Title Company |
|---|---|---|---|
| Horton David B | $189,900 | -- | |
| Wolicki Matthew J | $181,000 | -- | |
| Elson J Hershberger Const | $33,500 | -- |
Source: Public Records
Mortgage History
| Date | Status | Borrower | Loan Amount |
|---|---|---|---|
| Open | Horton David B | $151,920 | |
| Closed | Wolicki Matthew J | $171,900 | |
| Previous Owner | Elson J Hershberger Const | $1,000,000 | |
| Closed | Horton David B | $28,485 |
Source: Public Records
Tax History Compared to Growth
Tax History
| Year | Tax Paid | Tax Assessment Tax Assessment Total Assessment is a certain percentage of the fair market value that is determined by local assessors to be the total taxable value of land and additions on the property. | Land | Improvement |
|---|---|---|---|---|
| 2025 | -- | $95,660 | $22,750 | $72,910 |
| 2024 | -- | $95,660 | $22,750 | $72,910 |
| 2023 | $4,141 | $77,390 | $18,130 | $59,260 |
| 2022 | $3,974 | $77,390 | $18,130 | $59,260 |
| 2021 | $4,087 | $77,390 | $18,130 | $59,260 |
| 2020 | $3,975 | $68,740 | $15,610 | $53,130 |
| 2019 | $3,724 | $68,740 | $15,610 | $53,130 |
| 2018 | $3,856 | $68,740 | $15,610 | $53,130 |
| 2017 | $3,107 | $58,180 | $13,270 | $44,910 |
| 2016 | $3,119 | $58,180 | $13,270 | $44,910 |
| 2015 | $3,132 | $58,180 | $13,270 | $44,910 |
| 2014 | $1,076 | $54,080 | $12,360 | $41,720 |
| 2013 | $1,539 | $54,080 | $12,360 | $41,720 |
Source: Public Records
Map
Nearby Homes
- 11316 Cleveland Ave NW
- 10531 Newbury Ave NW
- 3048 Wright Rd NW
- 3026 Wright Rd NW
- 10380 Sudbury Cir NW
- 11056 Peach Glen Ave NW
- 3851 Cromford Cir NW
- 11065 Dunsby Ave NW
- 3863 Heckman St NW
- 3648 Mulberry St NW
- 2601 Lake Center St NW
- 10044 Cleveland Ave NW
- 3322 Perrydale St NW
- 12235 Cantburg Ave NW
- 9760 Summerset Ave NW
- 3047 Chalford Cir NW Unit 46B
- 1771 Midway St NW
- 2709 Country Squire St NW
- 9520-9570 Cleveland Ave NW
- 4943 Mayfair Rd
- 11046 Thoresby Cir NW
- 11034 Thoresby Cir NW
- 3114 Bucklers St NW
- 3132 Bucklers St NW
- 11052 Thoresby Cir NW
- 11028 Thoresby Cir NW
- 3096 Bucklers St NW
- 3148 Bucklers St NW
- 11037 Thoresby Cir NW
- 11049 Thoresby Cir NW
- 3164 Bucklers St NW
- 3074 Bucklers St NW
- 11060 Thoresby Cir NW
- 11025 Thoresby Cir NW
- 11020 Thoresby Cir NW
- 11055 Thoresby Cir NW
- 3062 Bucklers St NW
- 11126 Pickering Cir NW
- 11052 Newbury Ave NW
- 11115 Romsey Ave NW