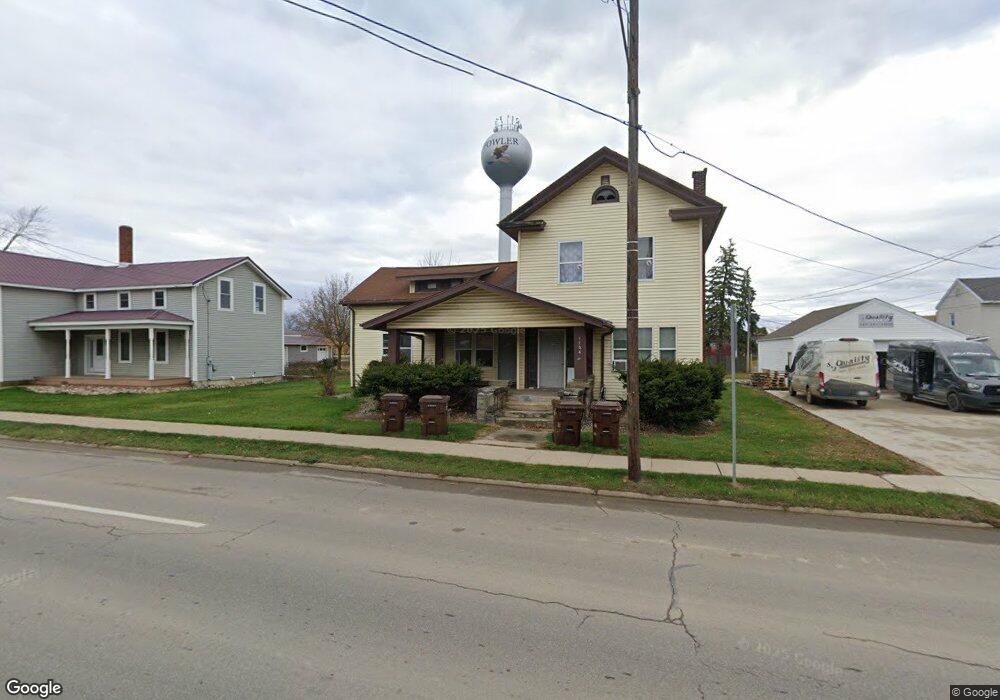
11040 W M21 Fowler, MI 48835
Estimated Value: $182,620 - $229,000
4
Beds
2
Baths
2,176
Sq Ft
$96/Sq Ft
Est. Value
About This Home
This home is located at 11040 W M21, Fowler, MI 48835 and is currently estimated at $207,905, approximately $95 per square foot. 11040 W M21 is a home located in Clinton County with nearby schools including Waldron Elementary/Middle School, Fowler High School, and Most Holy Trinity School.
Ownership History
Date
Name
Owned For
Owner Type
Purchase Details
Closed on
Jun 4, 2021
Sold by
Due Cani Investments Llc
Bought by
Rich Ro Dairy Llc
Current Estimated Value
Purchase Details
Closed on
Dec 16, 2015
Sold by
Thelen Dale L and Thelen Barbara A
Bought by
Due Cani Investments Llc
Home Financials for this Owner
Home Financials are based on the most recent Mortgage that was taken out on this home.
Original Mortgage
$42,000
Interest Rate
3.88%
Mortgage Type
Future Advance Clause Open End Mortgage
Purchase Details
Closed on
Nov 10, 2006
Sold by
Ohare Kimberly
Bought by
Daniels Christopher
Purchase Details
Closed on
Jun 26, 2006
Sold by
Ohare Dennis
Bought by
Daniels Christopher
Home Financials for this Owner
Home Financials are based on the most recent Mortgage that was taken out on this home.
Original Mortgage
$114,750
Interest Rate
6.73%
Mortgage Type
Purchase Money Mortgage
Create a Home Valuation Report for This Property
The Home Valuation Report is an in-depth analysis detailing your home's value as well as a comparison with similar homes in the area
Home Values in the Area
Average Home Value in this Area
Purchase History
| Date | Buyer | Sale Price | Title Company |
|---|---|---|---|
| Rich Ro Dairy Llc | $135,000 | Ata National Title Group Llc | |
| Due Cani Investments Llc | -- | Transnation Title Agency Mi | |
| Daniels Christopher | -- | None Available | |
| Daniels Christopher | $114,000 | None Available |
Source: Public Records
Mortgage History
| Date | Status | Borrower | Loan Amount |
|---|---|---|---|
| Previous Owner | Due Cani Investments Llc | $42,000 | |
| Previous Owner | Daniels Christopher | $114,750 |
Source: Public Records
Tax History Compared to Growth
Tax History
| Year | Tax Paid | Tax Assessment Tax Assessment Total Assessment is a certain percentage of the fair market value that is determined by local assessors to be the total taxable value of land and additions on the property. | Land | Improvement |
|---|---|---|---|---|
| 2025 | $3,478 | $86,000 | $25,800 | $60,200 |
| 2024 | $1,527 | $81,900 | $20,900 | $61,000 |
| 2023 | $1,449 | $74,400 | $0 | $0 |
| 2022 | $3,713 | $69,300 | $17,000 | $52,300 |
| 2021 | $2,610 | $67,400 | $16,400 | $51,000 |
| 2020 | $2,538 | $60,900 | $12,500 | $48,400 |
| 2019 | $2,260 | $57,000 | $10,600 | $46,400 |
| 2018 | $1,868 | $51,300 | $10,200 | $41,100 |
| 2017 | -- | $51,100 | $10,800 | $40,300 |
| 2016 | $2,305 | $44,300 | $10,800 | $33,500 |
| 2015 | -- | $44,900 | $0 | $0 |
| 2011 | -- | $48,300 | $0 | $0 |
Source: Public Records
Map
Nearby Homes
- V/L W M21
- 11138 W 2nd St
- 11255 W Wayne St
- 11040 W Ionia St
- 10911 E Kent St
- Lot 8 N Wright Rd
- 982 Norway Dr
- 154 S Yates St
- 0 Yates St
- 9515 W Moss Rd
- 5550 Paxton Rd
- 0 W Colony Unit 286993
- 0 W Colony Unit 292916
- 11670 Jessup Rd
- 7240 Empire Rd
- 8150 Idared Rd
- 7757 N Forest Hill Rd
- 8095 Mcintosh Rd
- 209 W Adelaide St
- 129 E Main St