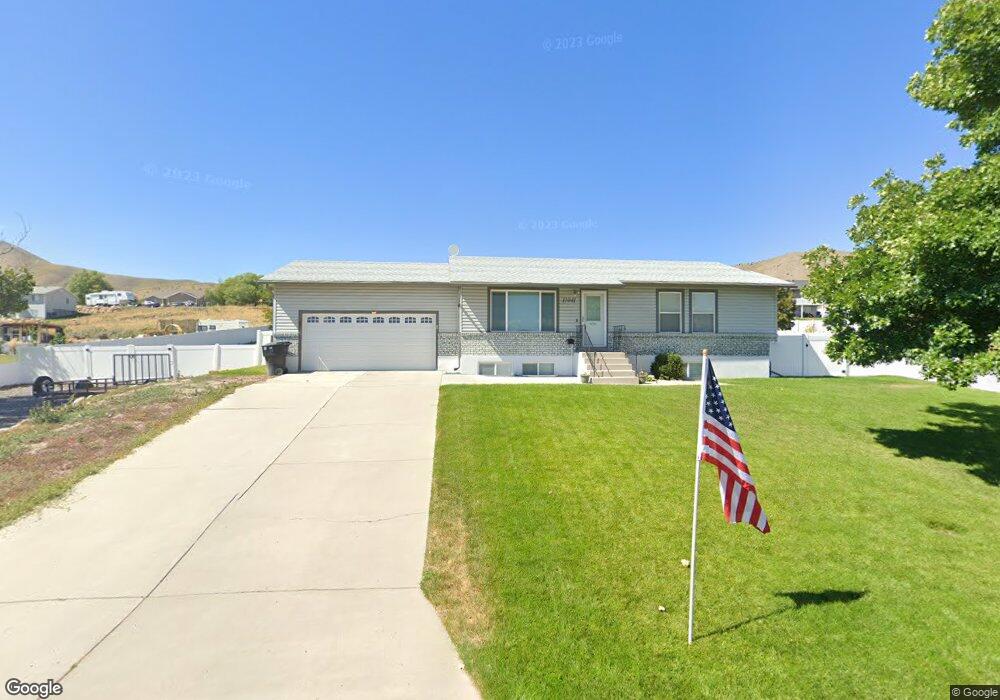
11041 N Anderson Way Tremonton, UT 84337
Estimated Value: $388,267 - $424,000
--
Bed
--
Bath
--
Sq Ft
0.52
Acres
About This Home
This home is located at 11041 N Anderson Way, Tremonton, UT 84337 and is currently estimated at $404,317. 11041 N Anderson Way is a home located in Box Elder County with nearby schools including Garland School, Alice C. Harris Intermediate School, and Bear River Middle School.
Ownership History
Date
Name
Owned For
Owner Type
Purchase Details
Closed on
Dec 7, 2015
Sold by
Msc Investments Llc
Bought by
Moore Dennie L and Moore Cara L
Current Estimated Value
Home Financials for this Owner
Home Financials are based on the most recent Mortgage that was taken out on this home.
Original Mortgage
$158,868
Outstanding Balance
$125,047
Interest Rate
3.73%
Mortgage Type
New Conventional
Estimated Equity
$279,270
Purchase Details
Closed on
Sep 11, 2015
Sold by
Olsen Matthew B and Olsen Amy M
Bought by
Msc Investments Llc
Purchase Details
Closed on
Jul 27, 2011
Sold by
Willie Wells G and Willie Marsha P
Bought by
Olsen Matthew B and Olsen Amy M
Home Financials for this Owner
Home Financials are based on the most recent Mortgage that was taken out on this home.
Original Mortgage
$162,694
Interest Rate
4.46%
Mortgage Type
New Conventional
Purchase Details
Closed on
Dec 16, 2009
Sold by
Willie Wells G and Willie Marsha P
Bought by
Willie Wells G and Willie Marsha P
Create a Home Valuation Report for This Property
The Home Valuation Report is an in-depth analysis detailing your home's value as well as a comparison with similar homes in the area
Home Values in the Area
Average Home Value in this Area
Purchase History
| Date | Buyer | Sale Price | Title Company |
|---|---|---|---|
| Moore Dennie L | -- | Northern Title Company | |
| Msc Investments Llc | $110,600 | Etitle Insurance Agency | |
| Olsen Matthew B | -- | Box Elder Alnd Title Compa | |
| Willie Wells G | -- | -- | |
| Willie Wells G | -- | -- |
Source: Public Records
Mortgage History
| Date | Status | Borrower | Loan Amount |
|---|---|---|---|
| Open | Moore Dennie L | $158,868 | |
| Previous Owner | Olsen Matthew B | $162,694 |
Source: Public Records
Tax History Compared to Growth
Tax History
| Year | Tax Paid | Tax Assessment Tax Assessment Total Assessment is a certain percentage of the fair market value that is determined by local assessors to be the total taxable value of land and additions on the property. | Land | Improvement |
|---|---|---|---|---|
| 2025 | $1,667 | $373,522 | $120,000 | $253,522 |
| 2024 | $1,667 | $371,144 | $120,000 | $251,144 |
| 2023 | $1,743 | $392,367 | $120,000 | $272,367 |
| 2022 | $1,622 | $189,278 | $22,000 | $167,278 |
| 2021 | $1,380 | $202,248 | $23,000 | $179,248 |
| 2020 | $1,101 | $202,248 | $23,000 | $179,248 |
| 2019 | $977 | $94,806 | $12,650 | $82,156 |
| 2018 | $927 | $84,090 | $12,650 | $71,440 |
| 2017 | $961 | $152,890 | $12,650 | $129,890 |
| 2016 | $915 | $80,688 | $12,650 | $68,038 |
| 2015 | $820 | $74,502 | $12,650 | $61,852 |
| 2014 | $820 | $71,557 | $12,650 | $58,907 |
| 2013 | -- | $66,202 | $12,650 | $53,552 |
Source: Public Records
Map
Nearby Homes
- Stanton Plan at Marble Hills
- Xavier Plan at Marble Hills
- Somerley Plan at Marble Hills
- Northfield Plan at Marble Hills
- Norfolk Plan at Marble Hills
- Knighton Plan at Marble Hills
- Kensington Plan at Marble Hills
- Denford Plan at Marble Hills
- Edgeworth Plan at Marble Hills
- Clearpoint Plan at Marble Hills
- Canyon Plan at Marble Hills
- Cambria Plan at Marble Hills
- Berrington Plan at Marble Hills
- Brantwood Plan at Marble Hills
- Ashland Plan at Marble Hills
- 10965 N Wallace Ln
- 10645 N 10800 W Unit 1
- 13464 N 10800 W Unit 4
- 9530 N 11600 W
- 10230 W 11200 N
- 11041 N Anderson Way
- 11041 N Anderson Way
- 11055 N Anderson Way
- 11050 N Anderson Way
- 11025 Anderson Way
- 11030 N Anderson Way
- 11016 N Anderson Way
- 11048 N Cullimore Ln
- 12505 Edna Way
- 11080 N Cullimore Ln
- 11005 Anderson Way
- 11040 N Cullimore Ln W Unit 125
- 12475 W Edna Way Unit 107
- 12475 W Edna Way Unit 107
- 12475 W Edna Way Unit 107
- 11000 N Anderson Way Unit 101
- 11092 Cullimore Ln
- 11029 N Wallace Ln
- 11092 N Cullimore Ln
- 11015 N Wallace Ln