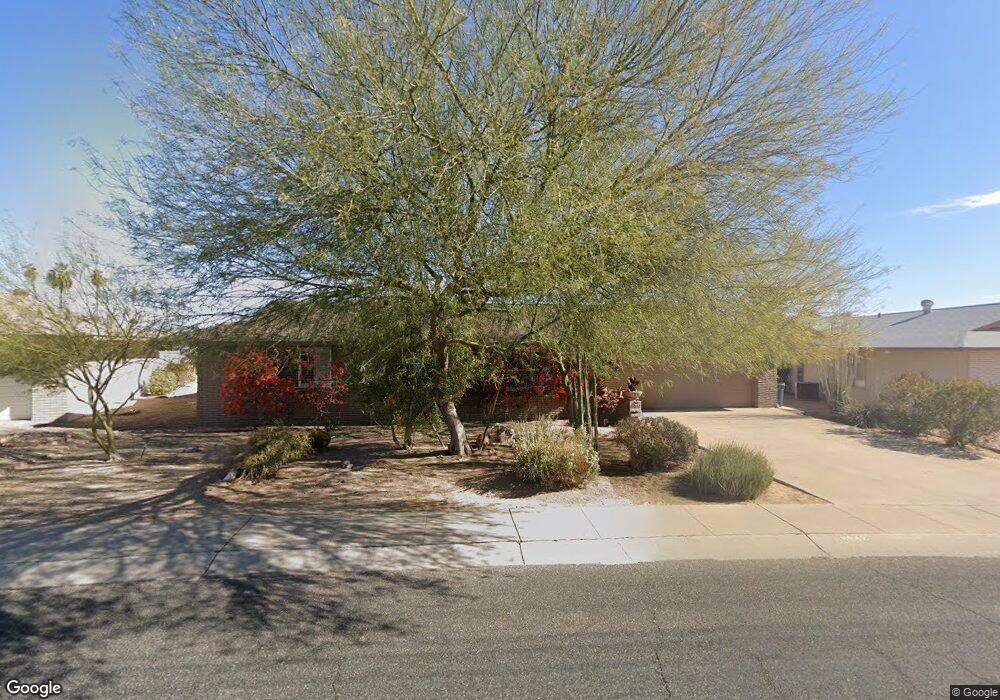
11042 W Oak Ridge Rd Sun City, AZ 85351
Estimated Value: $273,713 - $378,000
2
Beds
2
Baths
1,494
Sq Ft
$212/Sq Ft
Est. Value
About This Home
This home is located at 11042 W Oak Ridge Rd, Sun City, AZ 85351 and is currently estimated at $316,678, approximately $211 per square foot. 11042 W Oak Ridge Rd is a home located in Maricopa County with nearby schools including Desert Mirage Elementary School and Sonoran Science Academy-Peoria.
Ownership History
Date
Name
Owned For
Owner Type
Purchase Details
Closed on
Apr 10, 2007
Sold by
Spangler Karl and Spangler Patricia
Bought by
Shaver John T and Harris Steven K
Current Estimated Value
Home Financials for this Owner
Home Financials are based on the most recent Mortgage that was taken out on this home.
Original Mortgage
$128,800
Outstanding Balance
$103,254
Interest Rate
6.11%
Mortgage Type
New Conventional
Estimated Equity
$213,424
Purchase Details
Closed on
Jan 14, 2003
Sold by
Nelsen Eugene N and Nelsen Bonnie E
Bought by
Spangler Karl and Spangler Patricia
Purchase Details
Closed on
Sep 19, 1994
Sold by
Liparulo Margaret C
Bought by
Nelsen Eugene N and Nelsen Bonnie E
Home Financials for this Owner
Home Financials are based on the most recent Mortgage that was taken out on this home.
Original Mortgage
$74,800
Interest Rate
8.5%
Mortgage Type
New Conventional
Create a Home Valuation Report for This Property
The Home Valuation Report is an in-depth analysis detailing your home's value as well as a comparison with similar homes in the area
Home Values in the Area
Average Home Value in this Area
Purchase History
| Date | Buyer | Sale Price | Title Company |
|---|---|---|---|
| Shaver John T | $161,000 | Capital Title Agency Inc | |
| Spangler Karl | $113,000 | Century Title Agency Inc | |
| Nelsen Eugene N | $93,500 | First American Title |
Source: Public Records
Mortgage History
| Date | Status | Borrower | Loan Amount |
|---|---|---|---|
| Open | Shaver John T | $128,800 | |
| Previous Owner | Nelsen Eugene N | $74,800 |
Source: Public Records
Tax History Compared to Growth
Tax History
| Year | Tax Paid | Tax Assessment Tax Assessment Total Assessment is a certain percentage of the fair market value that is determined by local assessors to be the total taxable value of land and additions on the property. | Land | Improvement |
|---|---|---|---|---|
| 2025 | $1,177 | $14,589 | -- | -- |
| 2024 | $1,057 | $13,894 | -- | -- |
| 2023 | $1,057 | $23,470 | $4,690 | $18,780 |
| 2022 | $1,000 | $18,430 | $3,680 | $14,750 |
| 2021 | $1,032 | $17,310 | $3,460 | $13,850 |
| 2020 | $1,005 | $15,330 | $3,060 | $12,270 |
| 2019 | $990 | $14,370 | $2,870 | $11,500 |
| 2018 | $952 | $13,100 | $2,620 | $10,480 |
| 2017 | $920 | $11,680 | $2,330 | $9,350 |
| 2016 | $485 | $11,010 | $2,200 | $8,810 |
| 2015 | $821 | $10,170 | $2,030 | $8,140 |
Source: Public Records
Map
Nearby Homes
- 11011 W Pleasant Valley Rd
- 15808 N 109th Dr
- 11065 W Edgewood Dr
- 15912 N 109th Ave
- 11037 W Meade Dr
- 16210 N Agua Fria Dr
- 10940 W White Mountain Rd
- 16202 N 111th Ave
- 15408 N 111th Ave
- 10902 W Brookside Dr
- 10927 W White Mountain Rd
- 10826 W Brookside Dr
- 10731 W Tropicana Cir
- 16418 N 111th Ave
- 10722 W Tropicana Cir
- 10754 W Brookside Dr
- 10733 W Saratoga Cir
- 10739 W Saratoga Cir
- 10720 W Saratoga Cir
- 10760 W Saratoga Cir
- 11044 W Oak Ridge Rd
- 11041 W Fargo Dr
- 11043 W Fargo Dr
- 11038 W Oak Ridge Rd
- 11039 W Fargo Dr
- 11048 W Oak Ridge Rd
- 11041 W Oak Ridge Rd
- 11045 W Fargo Dr
- 11053 W Oak Ridge Rd
- 11039 W Oak Ridge Rd
- 11047 W Fargo Dr
- 11037 W Fargo Dr
- 11036 W Oak Ridge Rd
- 11052 W Oak Ridge Rd
- 11051 W Fargo Dr
- 11037 W Oak Ridge Rd Unit 35
- 11040 W Fargo Dr
- 11038 W Fargo Dr
- 11055 W Oak Ridge Rd
- 15805 N Agua Fria Dr