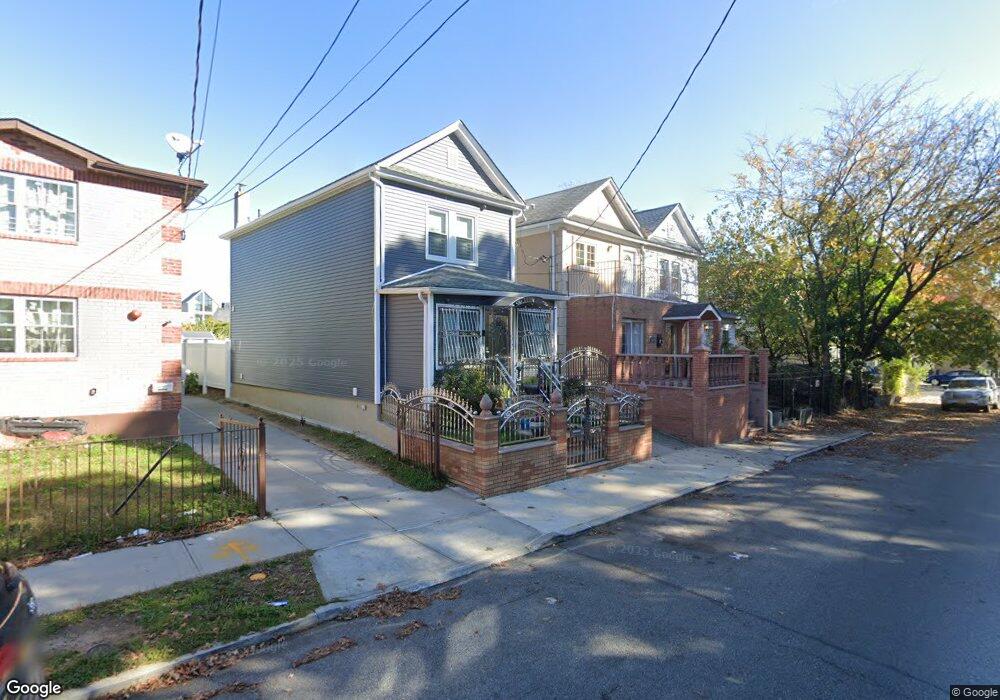
11049 Union Hall St Jamaica, NY 11433
Jamaica NeighborhoodEstimated Value: $531,988 - $793,000
--
Bed
--
Bath
756
Sq Ft
$911/Sq Ft
Est. Value
About This Home
This home is located at 11049 Union Hall St, Jamaica, NY 11433 and is currently estimated at $688,997, approximately $911 per square foot. 11049 Union Hall St is a home located in Queens County with nearby schools including Junior High School 8 Richard S Grossley.
Ownership History
Date
Name
Owned For
Owner Type
Purchase Details
Closed on
Apr 15, 2011
Sold by
Southgate Equities Inc
Bought by
Pearson Syd A
Current Estimated Value
Home Financials for this Owner
Home Financials are based on the most recent Mortgage that was taken out on this home.
Original Mortgage
$327,482
Outstanding Balance
$220,834
Interest Rate
4.4%
Mortgage Type
FHA
Estimated Equity
$468,163
Purchase Details
Closed on
Nov 30, 2010
Sold by
Emc Mortgage Corporation
Bought by
South Gate Equities Inc
Purchase Details
Closed on
May 8, 2009
Sold by
Helen A Cooper Gregory Esq As Referee
Bought by
Emc Mortgage Corporation
Purchase Details
Closed on
Jan 10, 2007
Sold by
Msimanga Themba
Bought by
Ogletree Larry
Purchase Details
Closed on
Jun 20, 2006
Sold by
Carnes Deceased Charity and Smith Administratrix
Bought by
Msimanga Themba
Create a Home Valuation Report for This Property
The Home Valuation Report is an in-depth analysis detailing your home's value as well as a comparison with similar homes in the area
Home Values in the Area
Average Home Value in this Area
Purchase History
| Date | Buyer | Sale Price | Title Company |
|---|---|---|---|
| Pearson Syd A | $336,000 | -- | |
| Pearson Syd A | $336,000 | -- | |
| South Gate Equities Inc | $165,000 | -- | |
| South Gate Equities Inc | $165,000 | -- | |
| Emc Mortgage Corporation | $523,193 | -- | |
| Emc Mortgage Corporation | $523,193 | -- | |
| Ogletree Larry | -- | -- | |
| Ogletree Larry | -- | -- | |
| Msimanga Themba | $153,000 | -- | |
| Msimanga Themba | $153,000 | -- |
Source: Public Records
Mortgage History
| Date | Status | Borrower | Loan Amount |
|---|---|---|---|
| Open | Pearson Syd A | $327,482 | |
| Closed | Pearson Syd A | $327,482 | |
| Closed | Ogletree Larry | $0 |
Source: Public Records
Tax History Compared to Growth
Tax History
| Year | Tax Paid | Tax Assessment Tax Assessment Total Assessment is a certain percentage of the fair market value that is determined by local assessors to be the total taxable value of land and additions on the property. | Land | Improvement |
|---|---|---|---|---|
| 2025 | $3,502 | $17,436 | $6,211 | $11,225 |
| 2024 | $3,502 | $17,435 | $6,389 | $11,046 |
| 2023 | $3,475 | $17,299 | $5,565 | $11,734 |
| 2022 | $3,259 | $29,880 | $9,960 | $19,920 |
| 2021 | $3,241 | $29,400 | $9,960 | $19,440 |
| 2020 | $3,076 | $29,160 | $9,960 | $19,200 |
| 2019 | $3,039 | $32,100 | $9,960 | $22,140 |
| 2018 | $2,939 | $14,416 | $6,364 | $8,052 |
| 2017 | $2,773 | $13,603 | $6,969 | $6,634 |
| 2016 | $2,566 | $13,603 | $6,969 | $6,634 |
| 2015 | $1,328 | $12,108 | $7,671 | $4,437 |
| 2014 | $1,328 | $12,108 | $6,511 | $5,597 |
Source: Public Records
Map
Nearby Homes
- 0 Guy R Brewer Blvd Unit KEY932885
- 11018 Union Hall St
- 110-03 Guy R Brewer Blvd Unit 40
- 11007 160th St
- 110-04 164th St
- 111-10 160th St
- 11003 164th Place
- 16310 Mathias Ave
- 109-10 Guy R Brewer Blvd
- 157-12 110th Ave Unit bld
- 110-31 166th St
- 11047 166th St
- 16427 109th Dr
- 164-46 109th Ave
- 156-17 110th Ave
- 15714 109th Ave
- 111-58 158th St
- 110-39 156th St
- 11281 Bedell St
- 11157 166th St
- 11047 Union Hall St
- 11051 Union Hall St
- 110-51 Union Hall St
- 11053 Union Hall St
- 11043 Union Hall St
- 16111 111th Ave
- 11057 Union Hall St
- 110-57 Union Hall St
- 11041 Union Hall St
- 11039 Union Hall St
- 11042 Guy R Brewer Blvd
- 11046 Guy R Brewer Blvd
- 11054 Guy R Brewer Blvd
- 11035 Union Hall St
- 16025 111th Ave
- 110-33 Union Hall St
- 11033 Union Hall St
- 110-40 Union Hall St
- 11058 Guy R Brewer Blvd
- 110-54 Guy R Brewer Blvd