
Landlord's Agent in 2025
Stuart Nesbitt
Nesbitt Realty
(703) 765-0300
16 in this area
82 Total Sales
Estimated Value: $318,000 - $353,000
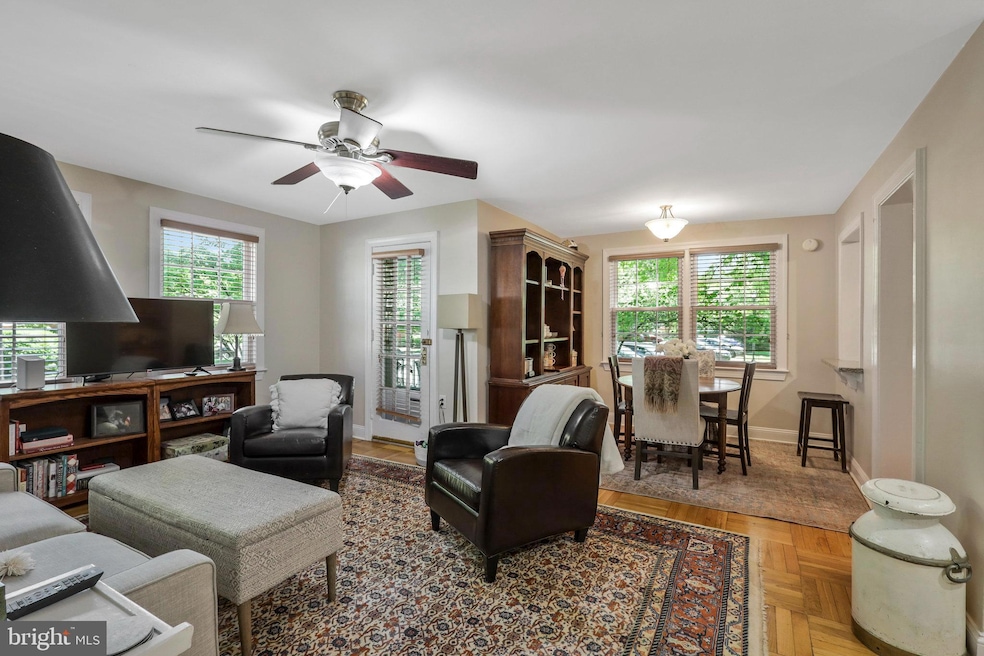
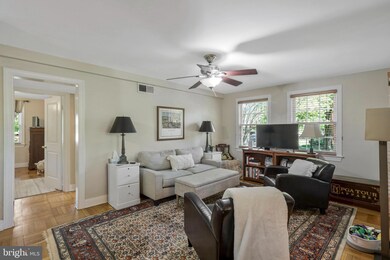
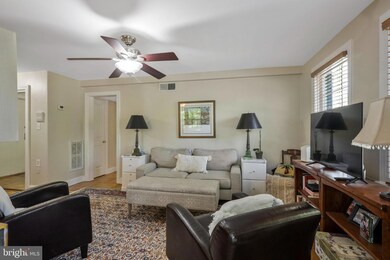
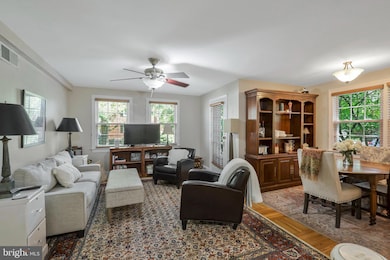
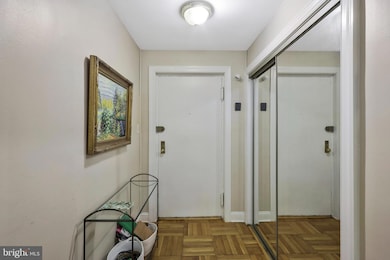
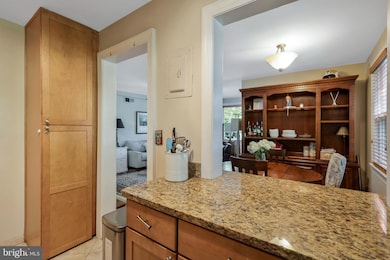
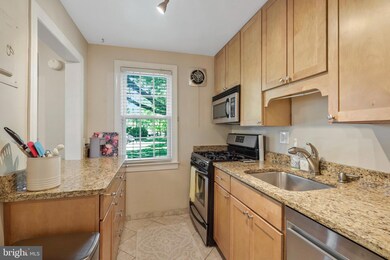
Spacious 2 Bedroom 1 Bath Porch Unit Available August 5th! Minutes to Fort Belvoir & the Pentagon. Easy access to Huntington Metro with routine bus service. Walking distance to restaurants, grocery & shopping. Easy access to the Mount Vernon Bike Trail. Rent includes gas & water, tenant pays electric. Washer/Dryer in basement of same tier and storage unit. Community amenities include a community pool, tennis courts & basketball courts.
Last Agent to Rent the Property
(703) 765-0300 snesbitt@nesbittrealty.com Nesbitt Realty License #0225203151 Listed on: 07/01/2025
Last Renter's Agent
(703) 765-0300 snesbitt@nesbittrealty.com Nesbitt Realty License #0225203151 Listed on: 07/01/2025
| Date | Buyer | Sale Price | Title Company |
|---|---|---|---|
| Robbins Charles B | $340,000 | First American Title | |
| Robbins Charles B | $340,000 | First American Title | |
| Grebe Robyn A | -- | -- | |
| Henisee Heather M | $220,000 | -- | |
| Federal National Mortgage Association | $245,026 | -- | |
| Roff Jonathan M | $282,000 | -- | |
| Wihtlock John | $219,000 | -- | |
| Forror Mark A | $98,000 | -- |
| Date | Status | Borrower | Loan Amount |
|---|---|---|---|
| Previous Owner | Grebe Robyn A | $240,000 | |
| Previous Owner | Grebe Robyn A | -- | |
| Previous Owner | Henisee Heather M | $209,000 | |
| Previous Owner | Roff Jonathan M | $225,600 | |
| Previous Owner | Wihtlock John | $225,570 | |
| Previous Owner | Forror Mark A | $95,750 |
| Date | Event | Price | List to Sale | Price per Sq Ft |
|---|---|---|---|---|
| 07/11/2025 07/11/25 | Rented | $2,140 | 0.0% | -- |
| 07/11/2025 07/11/25 | Under Contract | -- | -- | -- |
| 07/01/2025 07/01/25 | For Rent | $2,140 | +9.7% | -- |
| 08/01/2023 08/01/23 | Rented | $1,950 | 0.0% | -- |
| 06/19/2023 06/19/23 | Under Contract | -- | -- | -- |
| 06/14/2023 06/14/23 | For Rent | $1,950 | +18.2% | -- |
| 07/27/2020 07/27/20 | Rented | $1,650 | 0.0% | -- |
| 07/27/2020 07/27/20 | Under Contract | -- | -- | -- |
| 07/10/2020 07/10/20 | Price Changed | $1,650 | -4.3% | $2 / Sq Ft |
| 07/07/2020 07/07/20 | For Rent | $1,725 | 0.0% | -- |
| 06/30/2020 06/30/20 | Off Market | $1,725 | -- | -- |
| 06/18/2020 06/18/20 | For Rent | $1,725 | 0.0% | -- |
| 04/01/2020 04/01/20 | Off Market | $1,725 | -- | -- |
| 03/11/2020 03/11/20 | For Rent | $1,725 | -- | -- |
| Year | Tax Paid | Tax Assessment Tax Assessment Total Assessment is a certain percentage of the fair market value that is determined by local assessors to be the total taxable value of land and additions on the property. | Land | Improvement |
|---|---|---|---|---|
| 2025 | $3,336 | $320,330 | $64,000 | $256,330 |
| 2024 | $3,336 | $287,960 | $58,000 | $229,960 |
| 2023 | $3,155 | $279,570 | $56,000 | $223,570 |
| 2022 | $3,365 | $294,280 | $59,000 | $235,280 |
| 2021 | $3,321 | $282,960 | $57,000 | $225,960 |
| 2020 | $3,159 | $266,940 | $53,000 | $213,940 |
| 2019 | $2,849 | $240,740 | $48,000 | $192,740 |
| 2018 | $2,662 | $231,480 | $46,000 | $185,480 |
| 2017 | $2,581 | $222,350 | $44,000 | $178,350 |
| 2016 | $2,651 | $228,840 | $46,000 | $182,840 |
| 2015 | $2,504 | $224,350 | $45,000 | $179,350 |
| 2014 | $2,807 | $252,080 | $50,000 | $202,080 |
Landlord's Agent in 2025
Stuart Nesbitt
Nesbitt Realty
(703) 765-0300
16 in this area
82 Total Sales
Buyer's Agent in 2023
Waseem Halabi
KW Metro Center
(706) 288-4191
1 in this area
8 Total Sales
Source: Bright MLS
MLS Number: VAFX2241962
APN: 0932-13-1105A1
Disclaimer: Certain information contained herein is derived from information provided by parties other than Homes.com. All information provided is deemed reliable, but is not guaranteed to be accurate and should be independently verified.
![]() The data relating to real estate for sale on this website appears in part through the BRIGHT Internet Data Exchange program, a voluntary cooperative exchange of property listing data between licensed real estate brokerage firms, and is provided by BRIGHT through a licensing agreement.
The data relating to real estate for sale on this website appears in part through the BRIGHT Internet Data Exchange program, a voluntary cooperative exchange of property listing data between licensed real estate brokerage firms, and is provided by BRIGHT through a licensing agreement.
Listing information is from various brokers who participate in the Bright MLS IDX program and not all listings may be visible on the site.
The property information being provided on or through the website is for the personal, non-commercial use of consumers and such information may not be used for any purpose other than to identify prospective properties consumers may be interested in purchasing.
Some properties which appear for sale on the website may no longer be available because they are for instance, under contract, sold or are no longer being offered for sale.
Property information displayed is deemed reliable but is not guaranteed.
Copyright 2025 Bright MLS, Inc.