1105 Blackwell St Waycross, GA 31501
Estimated Value: $78,000 - $133,000
3
Beds
2
Baths
996
Sq Ft
$104/Sq Ft
Est. Value
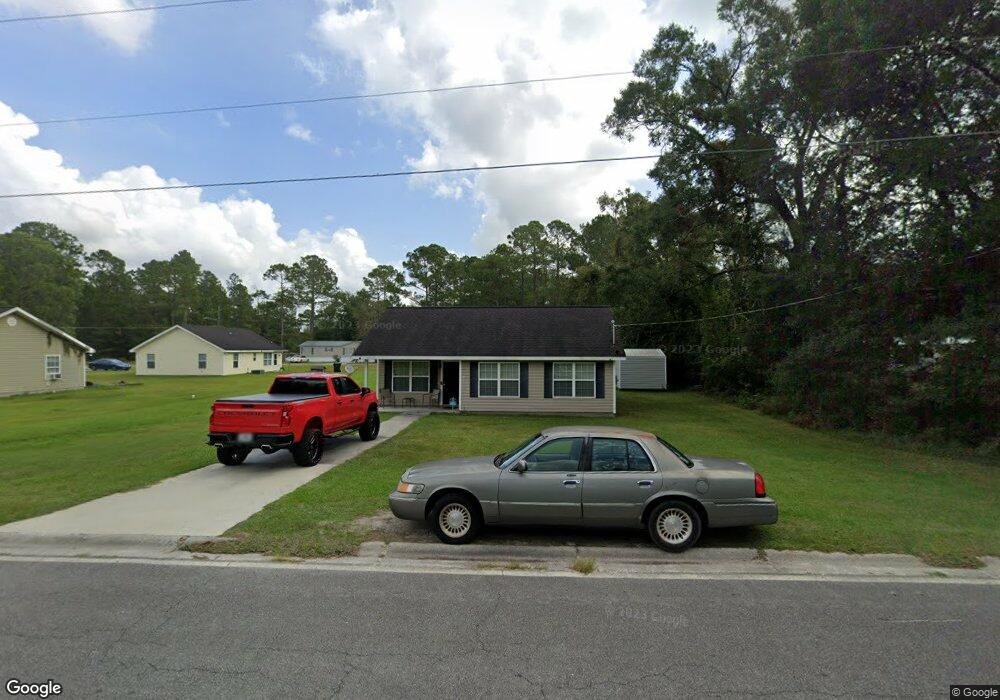
About This Home
This home is located at 1105 Blackwell St, Waycross, GA 31501 and is currently estimated at $103,518, approximately $103 per square foot. 1105 Blackwell St is a home located in Ware County with nearby schools including Memorial Drive Elementary School, Waycross Middle School, and Ware County High School.
Ownership History
Date
Name
Owned For
Owner Type
Purchase Details
Closed on
Sep 21, 2016
Bought by
Solomon Zenas R
Current Estimated Value
Home Financials for this Owner
Home Financials are based on the most recent Mortgage that was taken out on this home.
Original Mortgage
$43,650
Outstanding Balance
$34,866
Interest Rate
3.43%
Mortgage Type
New Conventional
Estimated Equity
$68,652
Purchase Details
Closed on
Nov 3, 2015
Sold by
Bank Of America
Bought by
Sec Of Housing & Urban
Purchase Details
Closed on
Jan 1, 2012
Sold by
Ross Christine
Bought by
Ross Christine
Purchase Details
Closed on
Jul 30, 2007
Sold by
Willingham Properties Llc
Bought by
Ross Christine
Home Financials for this Owner
Home Financials are based on the most recent Mortgage that was taken out on this home.
Original Mortgage
$63,945
Interest Rate
6.63%
Mortgage Type
FHA
Create a Home Valuation Report for This Property
The Home Valuation Report is an in-depth analysis detailing your home's value as well as a comparison with similar homes in the area
Home Values in the Area
Average Home Value in this Area
Purchase History
| Date | Buyer | Sale Price | Title Company |
|---|---|---|---|
| Solomon Zenas R | -- | -- | |
| Sec Of Housing & Urban | $73,435 | -- | |
| Bank Of America | $73,435 | -- | |
| Ross Christine | $65,100 | -- | |
| Ross Christine | $70,000 | -- |
Source: Public Records
Mortgage History
| Date | Status | Borrower | Loan Amount |
|---|---|---|---|
| Open | Solomon Zenas R | $43,650 | |
| Previous Owner | Ross Christine | $63,945 | |
| Previous Owner | Ross Christine | $10,000 |
Source: Public Records
Tax History Compared to Growth
Tax History
| Year | Tax Paid | Tax Assessment Tax Assessment Total Assessment is a certain percentage of the fair market value that is determined by local assessors to be the total taxable value of land and additions on the property. | Land | Improvement |
|---|---|---|---|---|
| 2024 | $625 | $30,525 | $1,680 | $28,845 |
| 2023 | $638 | $22,846 | $1,720 | $21,126 |
| 2022 | $723 | $22,846 | $1,720 | $21,126 |
| 2021 | $715 | $20,433 | $1,720 | $18,713 |
| 2020 | $721 | $19,619 | $1,720 | $17,899 |
| 2019 | $731 | $18,806 | $1,720 | $17,086 |
| 2018 | $738 | $17,992 | $1,720 | $16,272 |
| 2017 | $784 | $17,992 | $1,720 | $16,272 |
| 2016 | $784 | $17,992 | $1,720 | $16,272 |
| 2015 | $724 | $17,992 | $1,720 | $16,272 |
| 2014 | $676 | $16,907 | $1,720 | $15,187 |
| 2013 | -- | $19,800 | $1,720 | $18,080 |
Source: Public Records
Map
Nearby Homes
- 1117 House St
- 1101 Blackwell St
- 1206 Deputy St
- 1102 Congress St
- 1028 House St
- 1201 Blackwell St
- 1200 Blackwell St
- 000 House St
- 1203 Blackwell St
- 00 Congress St
- 1101 Deputy St
- 902 Deputy St
- 1024 House St
- 1209 Blackwell St
- 1024 Congress St
- 1025 Blackwell St
- 1035 Congress St
- 1023 Jackson St
- 1031 Congress St
- 1020 Congress St