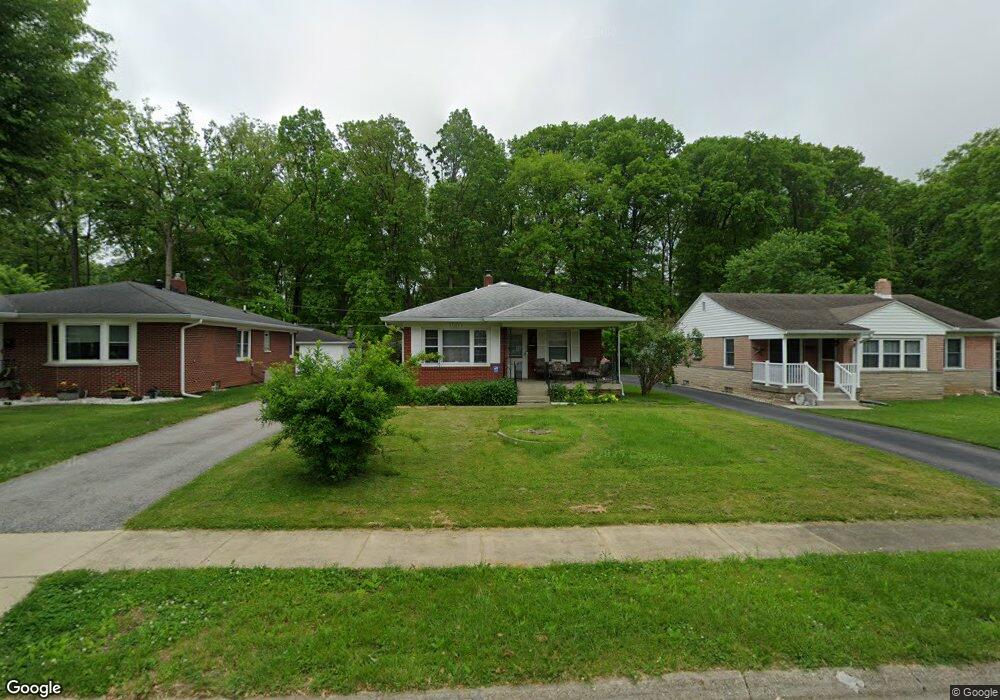
1105 Byland Dr Beech Grove, IN 46107
Estimated Value: $203,000 - $245,000
3
Beds
2
Baths
2,184
Sq Ft
$100/Sq Ft
Est. Value
About This Home
This home is located at 1105 Byland Dr, Beech Grove, IN 46107 and is currently estimated at $219,184, approximately $100 per square foot. 1105 Byland Dr is a home located in Marion County with nearby schools including Hornet Park Elementary School, Central Elementary School, and South Grove Intermediate School.
Ownership History
Date
Name
Owned For
Owner Type
Purchase Details
Closed on
Jun 2, 2011
Sold by
Frye Frank S and Estate Of Robert W Milliron
Bought by
Marschke Daniel H and Marschke Jacqueline K
Current Estimated Value
Home Financials for this Owner
Home Financials are based on the most recent Mortgage that was taken out on this home.
Original Mortgage
$77,770
Outstanding Balance
$53,914
Interest Rate
4.75%
Mortgage Type
FHA
Estimated Equity
$165,270
Create a Home Valuation Report for This Property
The Home Valuation Report is an in-depth analysis detailing your home's value as well as a comparison with similar homes in the area
Home Values in the Area
Average Home Value in this Area
Purchase History
| Date | Buyer | Sale Price | Title Company |
|---|---|---|---|
| Marschke Daniel H | -- | None Available |
Source: Public Records
Mortgage History
| Date | Status | Borrower | Loan Amount |
|---|---|---|---|
| Open | Marschke Daniel H | $77,770 |
Source: Public Records
Tax History Compared to Growth
Tax History
| Year | Tax Paid | Tax Assessment Tax Assessment Total Assessment is a certain percentage of the fair market value that is determined by local assessors to be the total taxable value of land and additions on the property. | Land | Improvement |
|---|---|---|---|---|
| 2024 | $2,093 | $170,100 | $16,800 | $153,300 |
| 2023 | $2,093 | $157,500 | $16,800 | $140,700 |
| 2022 | $1,906 | $140,000 | $16,800 | $123,200 |
| 2021 | $1,535 | $118,900 | $16,800 | $102,100 |
| 2020 | $1,334 | $109,800 | $16,800 | $93,000 |
| 2019 | $1,162 | $99,700 | $14,400 | $85,300 |
| 2018 | $1,079 | $95,400 | $14,400 | $81,000 |
| 2017 | $1,084 | $93,900 | $14,400 | $79,500 |
| 2016 | $1,046 | $91,600 | $14,400 | $77,200 |
| 2014 | $949 | $86,800 | $14,400 | $72,400 |
| 2013 | $949 | $86,800 | $14,400 | $72,400 |
Source: Public Records
Map
Nearby Homes