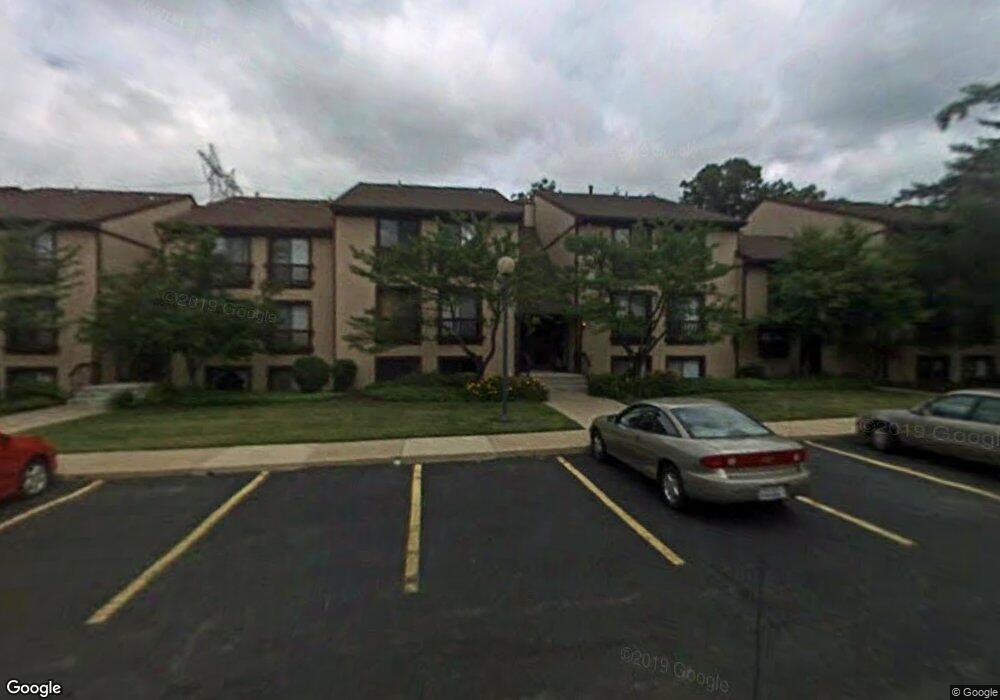
1105 Canyon View Rd Northfield, OH 44067
Estimated Value: $156,071 - $179,000
2
Beds
2
Baths
1,207
Sq Ft
$141/Sq Ft
Est. Value
About This Home
This home is located at 1105 Canyon View Rd, Northfield, OH 44067 and is currently estimated at $170,768, approximately $141 per square foot. 1105 Canyon View Rd is a home located in Summit County with nearby schools including Lee Eaton Elementary School, Nordonia Middle School, and Nordonia High School.
Ownership History
Date
Name
Owned For
Owner Type
Purchase Details
Closed on
May 17, 2022
Sold by
Ann Maduri Marissa
Bought by
Smith Mckenzie
Current Estimated Value
Purchase Details
Closed on
Jun 26, 2013
Sold by
Demuesy Angela and Demuesy Randall
Bought by
Maduri Marissa Ann
Home Financials for this Owner
Home Financials are based on the most recent Mortgage that was taken out on this home.
Original Mortgage
$59,000
Interest Rate
3.52%
Mortgage Type
Purchase Money Mortgage
Purchase Details
Closed on
Mar 22, 2000
Sold by
Bacon Thomas P
Bought by
Cipolla Angela
Home Financials for this Owner
Home Financials are based on the most recent Mortgage that was taken out on this home.
Original Mortgage
$62,000
Interest Rate
7.47%
Purchase Details
Closed on
Oct 20, 1998
Sold by
Douglas Storry James
Bought by
Bacon Thomas P
Home Financials for this Owner
Home Financials are based on the most recent Mortgage that was taken out on this home.
Original Mortgage
$67,450
Interest Rate
6.9%
Create a Home Valuation Report for This Property
The Home Valuation Report is an in-depth analysis detailing your home's value as well as a comparison with similar homes in the area
Home Values in the Area
Average Home Value in this Area
Purchase History
| Date | Buyer | Sale Price | Title Company |
|---|---|---|---|
| Smith Mckenzie | $141,500 | Ohio Real Title | |
| Maduri Marissa Ann | $77,000 | Guardian Title Box | |
| Cipolla Angela | $77,000 | Midland Commerce Group | |
| Bacon Thomas P | $71,000 | Midland Title Security Inc |
Source: Public Records
Mortgage History
| Date | Status | Borrower | Loan Amount |
|---|---|---|---|
| Previous Owner | Maduri Marissa Ann | $59,000 | |
| Previous Owner | Cipolla Angela | $62,000 | |
| Previous Owner | Bacon Thomas P | $67,450 |
Source: Public Records
Tax History Compared to Growth
Tax History
| Year | Tax Paid | Tax Assessment Tax Assessment Total Assessment is a certain percentage of the fair market value that is determined by local assessors to be the total taxable value of land and additions on the property. | Land | Improvement |
|---|---|---|---|---|
| 2025 | $4,202 | $41,626 | $5,229 | $36,397 |
| 2024 | $2,131 | $41,626 | $5,229 | $36,397 |
| 2023 | $4,202 | $41,626 | $5,229 | $36,397 |
| 2022 | $1,793 | $28,231 | $3,486 | $24,745 |
| 2021 | $1,758 | $28,231 | $3,486 | $24,745 |
| 2020 | $1,729 | $28,240 | $3,490 | $24,750 |
| 2019 | $1,553 | $22,700 | $3,070 | $19,630 |
| 2018 | $1,372 | $22,700 | $3,070 | $19,630 |
| 2017 | $1,560 | $22,700 | $3,070 | $19,630 |
| 2016 | $1,560 | $25,200 | $3,420 | $21,780 |
| 2015 | $1,560 | $25,200 | $3,420 | $21,780 |
| 2014 | $1,551 | $25,200 | $3,420 | $21,780 |
| 2013 | $1,611 | $26,450 | $3,420 | $23,030 |
Source: Public Records
Map
Nearby Homes
- 1115 Canyon View Rd Unit 504
- 1105 Canyon View Rd Unit 305
- 1105 Canyon View Rd Unit 106
- 6270 Greenwood Pkwy Unit 402
- 6280 Greenwood Pkwy Unit 202
- 6290 Greenwood Pkwy Unit 302
- 6320 Greenwood Pkwy Unit 100-4
- 6330 Greenwood Pkwy Unit 103
- 935 Canyon View Rd
- 938 Trimble Place Unit 3002H
- 842 Arboretum Cir
- 804 Arboretum Cir Unit 804
- 874 Hemlock Ln
- 796 Pipes Ct Unit 1604
- 7470 Millrace Ln
- 628 Windsor Ln
- 8134 N Boyden Rd
- 8094 Rolling Brook Rd
- 125 Old North Rd
- 6990 Crystal Creek Dr
- 1105 Canyon View Rd Unit 603
- 1105 Canyon View Rd
- 1105 Canyon View Rd
- 1105 Canyon View Rd
- 1105 Canyon View Rd
- 1105 Canyon View Rd
- 1105 Canyon View Rd
- 1105 Canyon View Rd Unit 104
- 1105 Canyon View Rd Unit 504
- 1105 Canyon View Rd
- 1105 Canyon View Rd
- 1105 Canyon View Rd Unit 502
- 1105 Canyon View Rd Unit 301
- 1105 Canyon View Rd
- 1105 Canyon View Rd Unit 102
- 1105 Canyon View Rd
- 1105 Canyon View Rd
- 1105 Canyon View Rd
- 1105 Canyon View Rd
- 1105 Canyon View Rd