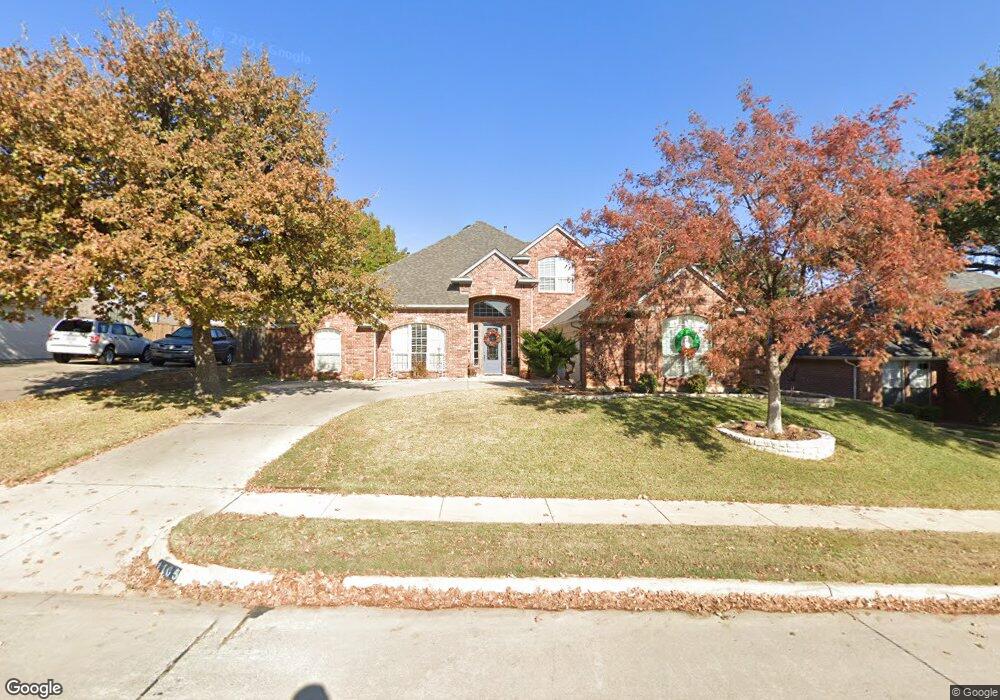
1105 Carousel Dr Bedford, TX 76021
Estimated Value: $550,000 - $704,000
3
Beds
2
Baths
2,645
Sq Ft
$227/Sq Ft
Est. Value
About This Home
This home is located at 1105 Carousel Dr, Bedford, TX 76021 and is currently estimated at $599,830, approximately $226 per square foot. 1105 Carousel Dr is a home located in Tarrant County with nearby schools including Bedford Heights Elementary School, Bedford Junior High School, and L.D. Bell High School.
Ownership History
Date
Name
Owned For
Owner Type
Purchase Details
Closed on
Oct 30, 2000
Sold by
Foreman Natalie
Bought by
Milano Gregory J and Milano Betty Jane
Current Estimated Value
Home Financials for this Owner
Home Financials are based on the most recent Mortgage that was taken out on this home.
Original Mortgage
$196,000
Outstanding Balance
$72,171
Interest Rate
7.87%
Estimated Equity
$527,659
Purchase Details
Closed on
Apr 26, 2000
Sold by
Foreman Alan Kurt
Bought by
Foreman Natalie Inna
Purchase Details
Closed on
Jun 26, 1998
Sold by
Hardesty Enterprises Inc
Bought by
Foreman Alan K and Foreman Natalie
Home Financials for this Owner
Home Financials are based on the most recent Mortgage that was taken out on this home.
Original Mortgage
$188,100
Interest Rate
7.13%
Purchase Details
Closed on
Oct 15, 1997
Sold by
United International Corp
Bought by
Hardesy Enterprises Inc and H E I Custom Homes
Create a Home Valuation Report for This Property
The Home Valuation Report is an in-depth analysis detailing your home's value as well as a comparison with similar homes in the area
Home Values in the Area
Average Home Value in this Area
Purchase History
| Date | Buyer | Sale Price | Title Company |
|---|---|---|---|
| Milano Gregory J | -- | American Title Co | |
| Foreman Natalie Inna | -- | -- | |
| Foreman Alan K | -- | Safeco Land Title Co | |
| Hardesy Enterprises Inc | -- | Safeco Land Title |
Source: Public Records
Mortgage History
| Date | Status | Borrower | Loan Amount |
|---|---|---|---|
| Open | Milano Gregory J | $196,000 | |
| Previous Owner | Foreman Alan K | $188,100 | |
| Closed | Milano Gregory J | $24,500 |
Source: Public Records
Tax History Compared to Growth
Tax History
| Year | Tax Paid | Tax Assessment Tax Assessment Total Assessment is a certain percentage of the fair market value that is determined by local assessors to be the total taxable value of land and additions on the property. | Land | Improvement |
|---|---|---|---|---|
| 2025 | $8,747 | $548,153 | $100,000 | $448,153 |
| 2024 | $8,747 | $548,153 | $100,000 | $448,153 |
| 2023 | $9,098 | $559,610 | $75,000 | $484,610 |
| 2022 | $9,418 | $474,494 | $75,000 | $399,494 |
| 2021 | $9,234 | $392,007 | $75,000 | $317,007 |
| 2020 | $9,031 | $379,829 | $75,000 | $304,829 |
| 2019 | $9,278 | $381,894 | $75,000 | $306,894 |
| 2018 | $8,297 | $357,229 | $75,000 | $282,229 |
| 2017 | $7,856 | $345,943 | $50,000 | $295,943 |
| 2016 | $7,142 | $295,231 | $50,000 | $245,231 |
| 2015 | $6,623 | $274,700 | $25,000 | $249,700 |
| 2014 | $6,623 | $274,700 | $25,000 | $249,700 |
Source: Public Records
Map
Nearby Homes
- 3301 Wendover Ct
- 1209 Hillandale Ct
- 913 Kensington Ct
- 1109 Simpson Terrace
- 3609 Wayne Ct
- 3624 Wayne Ct
- 1401 Danielle Dr
- 1136 Wingate Dr
- 3119 Spring Grove Dr
- 1013 Springdale Rd
- 3213 Spring Valley Dr
- 3605 Spring Valley Dr
- 922 Shady Creek Ln
- 801 Shady Creek Ln
- 2700 Shady Grove Dr
- 909 Brestol Ct W
- 1636 Bedford Oaks Dr
- 2901 Miles Way
- 1704 Indian Oaks Ct
- 2508 Lakeview Dr
- 1101 Carousel Dr
- 1109 Carousel Dr
- 1104 Crestview Dr
- 1100 Crestview Dr
- 1108 Crestview Dr
- 1113 Carousel Dr
- 1021 Carousel Dr
- 1108 Carousel Dr
- 1100 Carousel Dr
- 1112 Crestview Dr
- 1020 Crestview Dr
- 1117 Carousel Dr
- 1017 Carousel Dr
- 1112 Carousel Dr
- 1020 Carousel Dr
- 1016 Crestview Dr
- 1116 Crestview Dr
- 1117 Misty Woods Ct
- 1116 Carousel Dr
- 1016 Carousel Dr