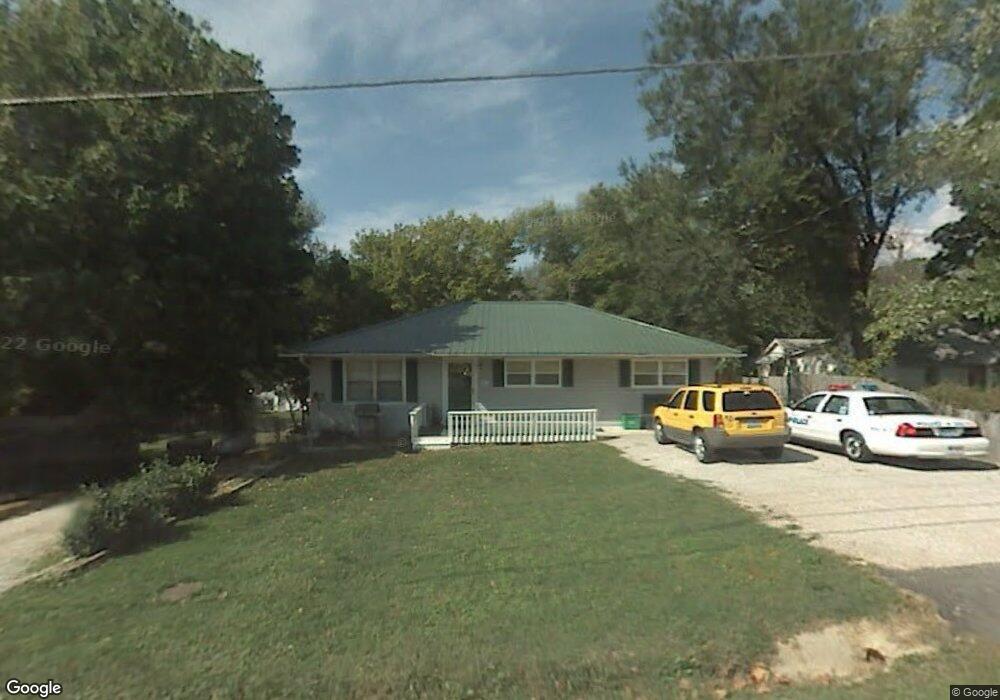
1105 Cedar Ave Cabool, MO 65689
Estimated Value: $119,185 - $176,000
2
Beds
--
Bath
1,232
Sq Ft
$114/Sq Ft
Est. Value
About This Home
This home is located at 1105 Cedar Ave, Cabool, MO 65689 and is currently estimated at $141,046, approximately $114 per square foot. 1105 Cedar Ave is a home with nearby schools including Cabool Elementary School, Cabool Middle School, and Cabool High School.
Ownership History
Date
Name
Owned For
Owner Type
Purchase Details
Closed on
Sep 16, 2014
Sold by
Melton Neil A and Melton John R
Bought by
Turnbull Brandon D
Current Estimated Value
Home Financials for this Owner
Home Financials are based on the most recent Mortgage that was taken out on this home.
Original Mortgage
$74,489
Outstanding Balance
$56,776
Interest Rate
4.1%
Mortgage Type
New Conventional
Estimated Equity
$84,270
Purchase Details
Closed on
Sep 13, 2007
Sold by
Sigman James L and Sigman Leigh A
Bought by
Melton Alvin L
Create a Home Valuation Report for This Property
The Home Valuation Report is an in-depth analysis detailing your home's value as well as a comparison with similar homes in the area
Purchase History
| Date | Buyer | Sale Price | Title Company |
|---|---|---|---|
| Turnbull Brandon D | -- | None Available | |
| Melton Alvin L | -- | None Available |
Source: Public Records
Mortgage History
| Date | Status | Borrower | Loan Amount |
|---|---|---|---|
| Open | Turnbull Brandon D | $74,489 |
Source: Public Records
Tax History
| Year | Tax Paid | Tax Assessment Tax Assessment Total Assessment is a certain percentage of the fair market value that is determined by local assessors to be the total taxable value of land and additions on the property. | Land | Improvement |
|---|---|---|---|---|
| 2025 | $484 | $9,560 | $0 | $0 |
| 2024 | $484 | $9,560 | $0 | $0 |
| 2023 | $487 | $9,560 | $0 | $0 |
| 2022 | $448 | $8,840 | $0 | $0 |
| 2020 | $433 | $8,840 | $0 | $0 |
| 2019 | $433 | $8,840 | $0 | $0 |
| 2018 | $379 | $7,950 | $0 | $0 |
| 2017 | $378 | $7,950 | $0 | $0 |
| 2016 | $393 | $8,220 | $0 | $0 |
| 2015 | -- | $8,220 | $0 | $0 |
| 2014 | -- | $8,220 | $0 | $0 |
| 2013 | -- | $8,220 | $0 | $0 |
Source: Public Records
Map
Nearby Homes
Your Personal Tour Guide
Ask me questions while you tour the home.