Estimated Value: $317,000 - $343,000
4
Beds
2
Baths
1,754
Sq Ft
$187/Sq Ft
Est. Value
About This Home
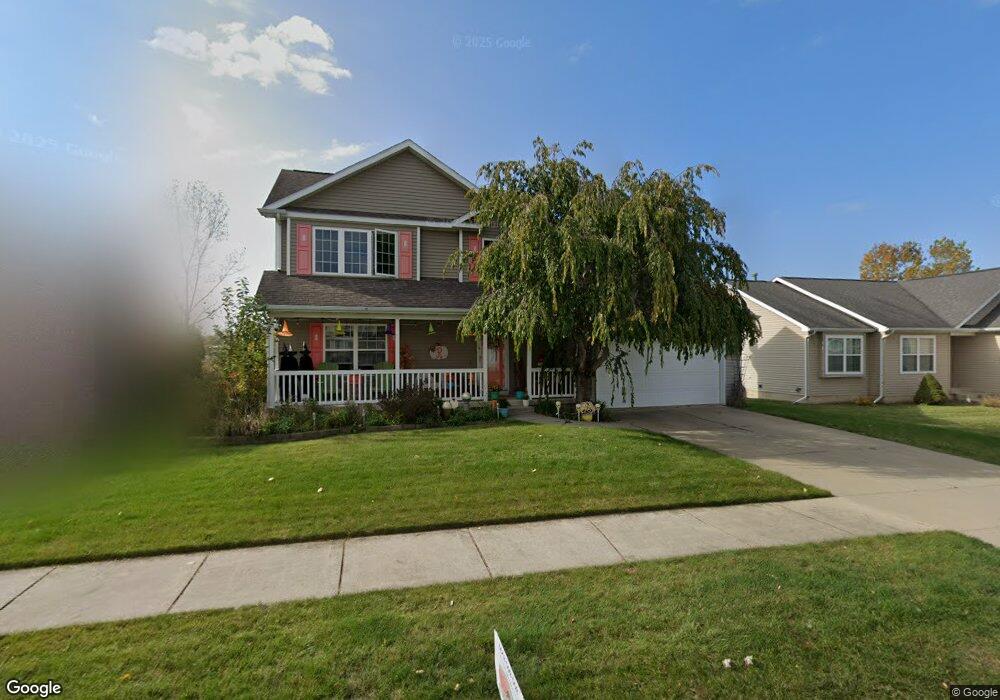
This home is located at 1105 Cranbrook Ln Unit 49, Mason, MI 48854 and is currently estimated at $327,699, approximately $186 per square foot. 1105 Cranbrook Ln Unit 49 is a home located in Ingham County with nearby schools including Mason High School and Central Lutheran High School.
Ownership History
Date
Name
Owned For
Owner Type
Purchase Details
Closed on
Oct 19, 2012
Sold by
Rogers Warren J and Rogers Kathryn E
Bought by
Rogers Warren J and Rogers Kathryn E
Current Estimated Value
Home Financials for this Owner
Home Financials are based on the most recent Mortgage that was taken out on this home.
Original Mortgage
$132,000
Outstanding Balance
$22,588
Interest Rate
3.4%
Estimated Equity
$305,111
Purchase Details
Closed on
Jan 13, 2006
Sold by
Westridge Homes Inc
Bought by
Rogers Warren J and Schneider Kathryn E
Home Financials for this Owner
Home Financials are based on the most recent Mortgage that was taken out on this home.
Original Mortgage
$142,400
Interest Rate
6.3%
Purchase Details
Closed on
Nov 22, 2005
Sold by
Delhi Gardens Llc
Bought by
Westridge Homes Inc
Home Financials for this Owner
Home Financials are based on the most recent Mortgage that was taken out on this home.
Original Mortgage
$142,400
Interest Rate
6.3%
Create a Home Valuation Report for This Property
The Home Valuation Report is an in-depth analysis detailing your home's value as well as a comparison with similar homes in the area
Home Values in the Area
Average Home Value in this Area
Purchase History
| Date | Buyer | Sale Price | Title Company |
|---|---|---|---|
| Rogers Warren J | -- | None Available | |
| Rogers Warren J | $38,000 | None Available | |
| Westridge Homes Inc | $76,000 | None Available |
Source: Public Records
Mortgage History
| Date | Status | Borrower | Loan Amount |
|---|---|---|---|
| Open | Rogers Warren J | $132,000 | |
| Previous Owner | Rogers Warren J | $142,400 |
Source: Public Records
Tax History Compared to Growth
Tax History
| Year | Tax Paid | Tax Assessment Tax Assessment Total Assessment is a certain percentage of the fair market value that is determined by local assessors to be the total taxable value of land and additions on the property. | Land | Improvement |
|---|---|---|---|---|
| 2025 | $5,192 | $148,500 | $38,900 | $109,600 |
| 2024 | $13 | $144,800 | $35,400 | $109,400 |
| 2023 | $4,834 | $129,400 | $28,300 | $101,100 |
| 2022 | $4,605 | $113,700 | $21,200 | $92,500 |
| 2021 | $4,535 | $105,100 | $15,500 | $89,600 |
| 2020 | $4,484 | $99,000 | $15,500 | $83,500 |
| 2019 | $4,287 | $96,900 | $14,500 | $82,400 |
| 2018 | $4,261 | $89,700 | $14,500 | $75,200 |
| 2017 | $3,706 | $89,700 | $14,500 | $75,200 |
| 2016 | $3,651 | $85,900 | $15,900 | $70,000 |
| 2015 | $3,717 | $85,100 | $31,792 | $53,308 |
| 2014 | $3,717 | $82,700 | $31,792 | $50,908 |
Source: Public Records
Map
Nearby Homes
- 3601 Beal Ln
- 673 Joan Dr
- 871 Dart Rd
- 1198 Wildflower Dr
- 2995 Harper Rd
- 1566 Berkley Dr
- 1596 Berkley Dr
- 331 N College Rd
- 4535 Harper Rd
- 4344 Willesdon Ave
- 4535 Garden Gate Unit 21
- 1535 Thimbleberry Dr
- 4245 Holt Rd
- 4261 Holt Rd
- 4198 Greenwood Ave
- 1942 Walnut St
- 4786 Harper Rd
- 1947 Maple St
- 0 Aurelius Rd Unit 282659
- 2058 Park Ln
- 1111 Cranbrook Ln Unit 48
- 1099 Cranbrook Ln Unit 49
- 1093 Cranbrook Ln Unit 51
- 1121 Cranbrook Ln Unit 47
- 1106 Cranbrook Ln Unit 27
- 1094 Cranbrook Ln Unit 25
- 1112 Cranbrook Ln Unit 28
- 1118 Cranbrook Ln Unit 29
- 3668 Fernwood Ln Unit 24
- 3679 Fernwood Ln Unit 31
- 1124 Cranbrook Ln
- 1130 Cranbrook Ln
- 3669 Fernwood Ln Unit 2
- 3662 Fernwood Ln Unit 23
- 1136 Cranbrook Ln Unit 32
- 3665 Fernwood Ln Unit 3
- 3717 Meijer Ct
- 3711 Meijer Ct Unit 44
- 3703 Meijer Ct