Estimated Value: $728,000 - $784,000
5
Beds
3
Baths
3,308
Sq Ft
$227/Sq Ft
Est. Value
About This Home
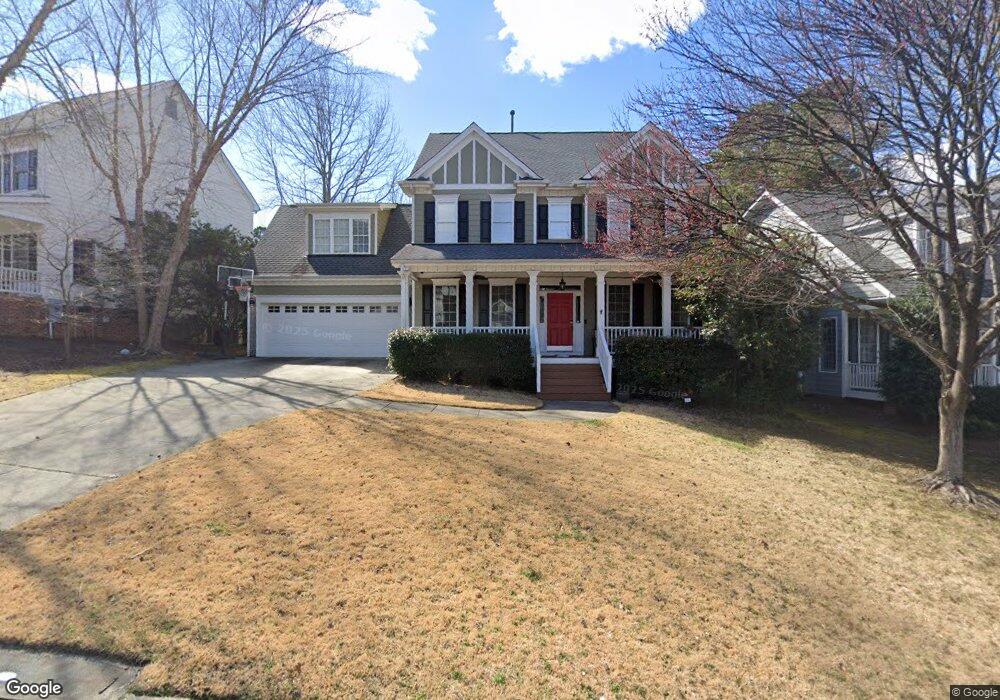
This home is located at 1105 Dalgarven Dr, Apex, NC 27502 and is currently estimated at $750,138, approximately $226 per square foot. 1105 Dalgarven Dr is a home located in Wake County with nearby schools including Scotts Ridge Elementary School, Apex Middle, and Apex High School.
Ownership History
Date
Name
Owned For
Owner Type
Purchase Details
Closed on
Dec 29, 2015
Sold by
Tilley Daniel A
Bought by
Galloway Nicholas B and Galloway Stacie B
Current Estimated Value
Home Financials for this Owner
Home Financials are based on the most recent Mortgage that was taken out on this home.
Original Mortgage
$351,025
Outstanding Balance
$279,178
Interest Rate
3.96%
Mortgage Type
New Conventional
Estimated Equity
$470,960
Purchase Details
Closed on
Dec 19, 2002
Sold by
Cullen Thomas B and Cullen Julie Ann
Bought by
Tilley Daniel A and Petralia Kimberly C
Home Financials for this Owner
Home Financials are based on the most recent Mortgage that was taken out on this home.
Original Mortgage
$247,500
Interest Rate
5%
Purchase Details
Closed on
Aug 8, 2001
Sold by
Jvi Construction Inc
Bought by
Cullen Thomas B and Cullen Cynthia A
Home Financials for this Owner
Home Financials are based on the most recent Mortgage that was taken out on this home.
Original Mortgage
$225,916
Interest Rate
7.1%
Create a Home Valuation Report for This Property
The Home Valuation Report is an in-depth analysis detailing your home's value as well as a comparison with similar homes in the area
Home Values in the Area
Average Home Value in this Area
Purchase History
| Date | Buyer | Sale Price | Title Company |
|---|---|---|---|
| Galloway Nicholas B | $369,500 | None Available | |
| Tilley Daniel A | $275,000 | -- | |
| Cullen Thomas B | $282,500 | -- |
Source: Public Records
Mortgage History
| Date | Status | Borrower | Loan Amount |
|---|---|---|---|
| Open | Galloway Nicholas B | $351,025 | |
| Previous Owner | Tilley Daniel A | $247,500 | |
| Previous Owner | Cullen Thomas B | $225,916 | |
| Closed | Cullen Thomas B | $28,239 |
Source: Public Records
Tax History Compared to Growth
Tax History
| Year | Tax Paid | Tax Assessment Tax Assessment Total Assessment is a certain percentage of the fair market value that is determined by local assessors to be the total taxable value of land and additions on the property. | Land | Improvement |
|---|---|---|---|---|
| 2025 | $6,107 | $697,132 | $180,000 | $517,132 |
| 2024 | $5,904 | $689,365 | $180,000 | $509,365 |
| 2023 | $5,073 | $460,585 | $73,000 | $387,585 |
| 2022 | $4,762 | $460,585 | $73,000 | $387,585 |
| 2021 | $4,580 | $460,585 | $73,000 | $387,585 |
| 2020 | $4,534 | $460,585 | $73,000 | $387,585 |
| 2019 | $4,311 | $377,786 | $73,000 | $304,786 |
| 2018 | $4,060 | $380,218 | $73,000 | $307,218 |
| 2017 | $3,803 | $380,218 | $73,000 | $307,218 |
| 2016 | $3,408 | $345,531 | $73,000 | $272,531 |
| 2015 | $3,336 | $330,105 | $68,000 | $262,105 |
| 2014 | -- | $330,105 | $68,000 | $262,105 |
Source: Public Records
Map
Nearby Homes
- 1105 Capitata Crossing
- 1208 Tartarian Trail
- 1116 Silky Dogwood Trail
- 2008 Silky Dogwood Trail
- 0 Jb Morgan Rd Unit 10051948
- 209 Homegate Cir
- 1800 Pierre Place
- 3014 Silky Dogwood Trail
- 541 Village Loop Dr
- 1311 Pendula Path
- 402 Village Loop Dr
- 103 Garden Side Way
- 441 Heritage Village Ln
- 460 Heritage Village Ln
- 448 Heritage Village Ln
- 428 Heritage Village Ln
- 1773 Town Home Dr
- 104 Pine Tag Ct
- 105 Troyer Place
- 1209 Haywards Heath Ln
- 1109 Dalgarven Dr
- 1101 Dalgarven Dr
- 1201 Dalgarven Dr
- 100 Lethaby Ct
- 1008 Manderston Ln
- 1209 Dalgarven Dr
- 1100 Dalgarven Dr
- 1008 Dalgarven Dr
- 1001 Manderston Ln
- 1012 Manderston Ln
- 104 Lethaby Ct
- 1005 Manderston Ln
- 1200 Dalgarven Dr
- 1217 Dalgarven Dr
- 1004 Dalgarven Dr
- 1009 Manderston Ln
- 1204 Dalgarven Dr
- 1016 Manderston Ln
- 108 Lethaby Ct
- 1221 Dalgarven Dr