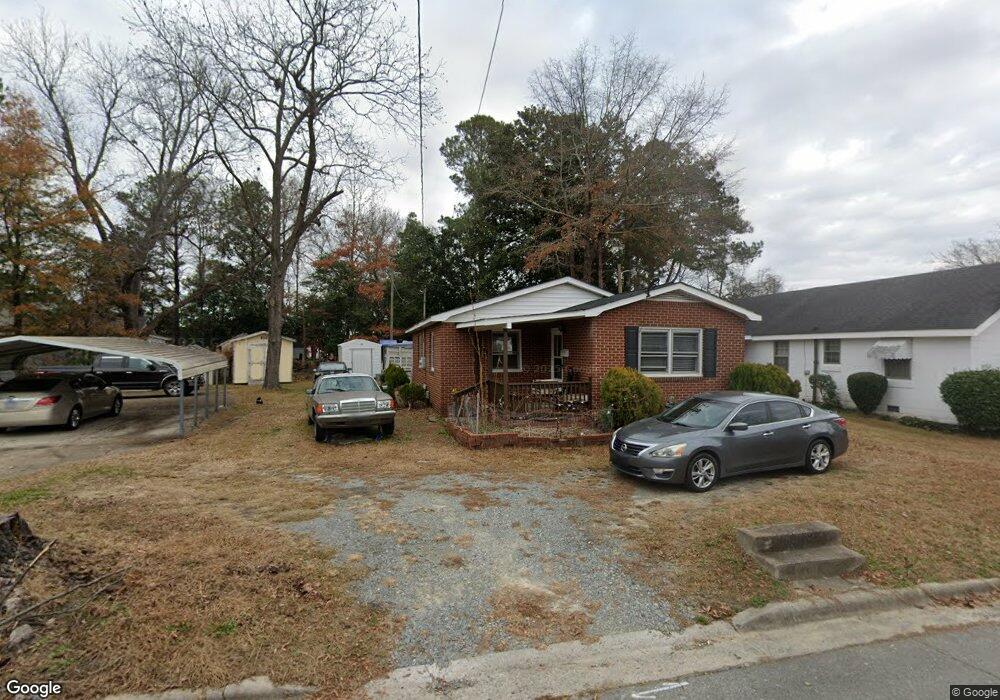
1105 Fuller St Smithfield, NC 27577
Estimated Value: $145,000 - $169,241
3
Beds
1
Bath
908
Sq Ft
$167/Sq Ft
Est. Value
About This Home
This home is located at 1105 Fuller St, Smithfield, NC 27577 and is currently estimated at $152,060, approximately $167 per square foot. 1105 Fuller St is a home located in Johnston County with nearby schools including West Smithfield Elementary School, Smithfield Middle School, and Smithfield-Selma High School.
Ownership History
Date
Name
Owned For
Owner Type
Purchase Details
Closed on
Feb 29, 2024
Sold by
Johnson Brenda C
Bought by
Harris Marcia Veronica Phi and Harris Ervin
Current Estimated Value
Home Financials for this Owner
Home Financials are based on the most recent Mortgage that was taken out on this home.
Original Mortgage
$135,500
Outstanding Balance
$133,233
Interest Rate
6.6%
Mortgage Type
FHA
Estimated Equity
$18,827
Purchase Details
Closed on
Mar 7, 2006
Sold by
Johnson Joseph C and Johnson Brenda C
Bought by
Johnson Joseph C and Johnson Brenda C
Create a Home Valuation Report for This Property
The Home Valuation Report is an in-depth analysis detailing your home's value as well as a comparison with similar homes in the area
Home Values in the Area
Average Home Value in this Area
Purchase History
| Date | Buyer | Sale Price | Title Company |
|---|---|---|---|
| Harris Marcia Veronica Phi | $138,000 | None Listed On Document | |
| Johnson Joseph C | -- | None Available |
Source: Public Records
Mortgage History
| Date | Status | Borrower | Loan Amount |
|---|---|---|---|
| Open | Harris Marcia Veronica Phi | $135,500 |
Source: Public Records
Tax History
| Year | Tax Paid | Tax Assessment Tax Assessment Total Assessment is a certain percentage of the fair market value that is determined by local assessors to be the total taxable value of land and additions on the property. | Land | Improvement |
|---|---|---|---|---|
| 2025 | $1,372 | $141,400 | $19,210 | $122,190 |
| 2024 | $579 | $46,720 | $9,480 | $37,240 |
| 2023 | $589 | $46,720 | $9,480 | $37,240 |
| 2022 | $607 | $46,720 | $9,480 | $37,240 |
| 2021 | $607 | $46,720 | $9,480 | $37,240 |
| 2020 | $621 | $46,720 | $9,480 | $37,240 |
| 2019 | $621 | $46,720 | $9,480 | $37,240 |
| 2018 | $0 | $47,140 | $9,480 | $37,660 |
| 2017 | $636 | $47,140 | $9,480 | $37,660 |
| 2016 | $636 | $47,140 | $9,480 | $37,660 |
| 2015 | $636 | $47,140 | $9,480 | $37,660 |
| 2014 | $636 | $47,140 | $9,480 | $37,660 |
Source: Public Records
Map
Nearby Homes
- 407 Collier St
- 707 Massey St
- 212 S 6th St
- 720 Martin Luther King Junior Dr
- 722 Martin Luther King Junior Dr
- 429 S 5th St
- 412 S 5th St
- 514 S 5th St
- 407 E Woodall St
- 91 Lotus Ave
- 706 Caswell St
- 313 S 4th St
- 510 S 4th St
- 310 N 6th St Unit 21
- 804 Midway St
- 38 Muscadine Way
- 1211 North St
- 510 Pine St
- 821 S 5th St
- 408 Oak St
Your Personal Tour Guide
Ask me questions while you tour the home.