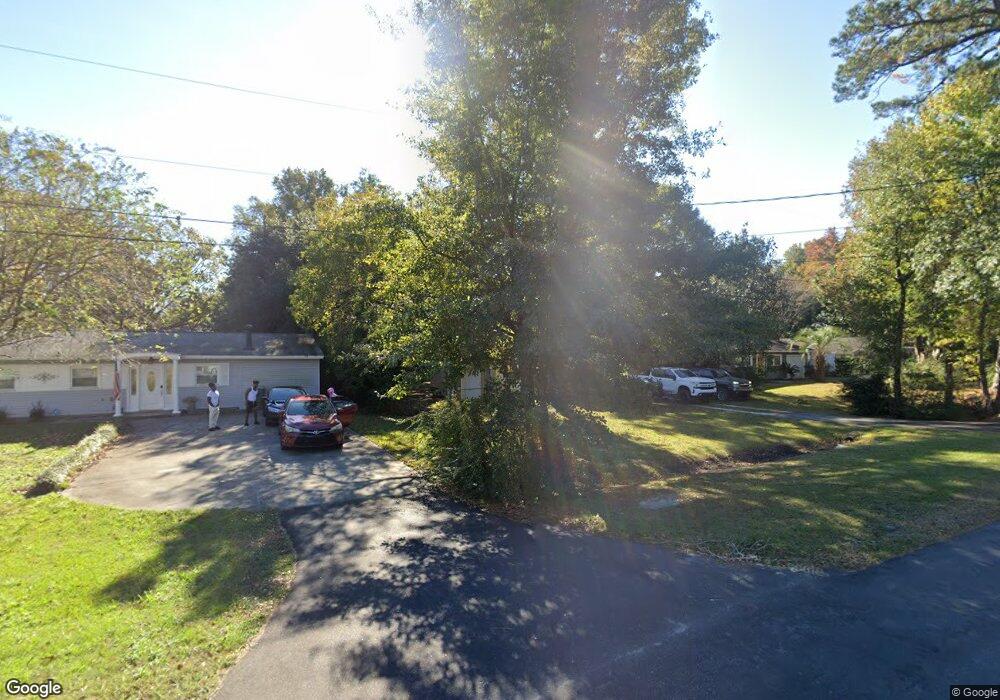
1105 Hawthorne Rd Hanahan, SC 29410
Estimated Value: $294,000 - $303,078
3
Beds
1
Bath
972
Sq Ft
$307/Sq Ft
Est. Value
About This Home
This home is located at 1105 Hawthorne Rd, Hanahan, SC 29410 and is currently estimated at $298,270, approximately $306 per square foot. 1105 Hawthorne Rd is a home located in Berkeley County with nearby schools including Hanahan Elementary School, Hanahan Middle School, and Hanahan High School.
Ownership History
Date
Name
Owned For
Owner Type
Purchase Details
Closed on
Aug 27, 2021
Sold by
Henderson Chris L
Bought by
Davis Jerry Lee
Current Estimated Value
Home Financials for this Owner
Home Financials are based on the most recent Mortgage that was taken out on this home.
Original Mortgage
$198,850
Outstanding Balance
$180,939
Interest Rate
2.8%
Mortgage Type
New Conventional
Estimated Equity
$117,331
Purchase Details
Closed on
Feb 23, 2018
Sold by
Guy David Christopher and Guy Matthew Wayne
Bought by
Henderson Christopher L
Home Financials for this Owner
Home Financials are based on the most recent Mortgage that was taken out on this home.
Original Mortgage
$60,000
Interest Rate
4.04%
Mortgage Type
New Conventional
Purchase Details
Closed on
Oct 14, 2013
Sold by
Estate Of Clyde Wayne Guy and Guy Margaret A
Bought by
Guy David Christopher and Guy Matthew Wayne
Create a Home Valuation Report for This Property
The Home Valuation Report is an in-depth analysis detailing your home's value as well as a comparison with similar homes in the area
Home Values in the Area
Average Home Value in this Area
Purchase History
| Date | Buyer | Sale Price | Title Company |
|---|---|---|---|
| Davis Jerry Lee | $205,000 | None Available | |
| Henderson Christopher L | $75,000 | None Available | |
| Guy David Christopher | -- | -- |
Source: Public Records
Mortgage History
| Date | Status | Borrower | Loan Amount |
|---|---|---|---|
| Open | Davis Jerry Lee | $198,850 | |
| Previous Owner | Henderson Christopher L | $60,000 |
Source: Public Records
Tax History Compared to Growth
Tax History
| Year | Tax Paid | Tax Assessment Tax Assessment Total Assessment is a certain percentage of the fair market value that is determined by local assessors to be the total taxable value of land and additions on the property. | Land | Improvement |
|---|---|---|---|---|
| 2025 | $1,327 | $283,015 | $53,686 | $229,329 |
| 2024 | $1,327 | $11,320 | $2,147 | $9,173 |
| 2023 | $1,327 | $11,320 | $2,147 | $9,173 |
| 2022 | $4,762 | $9,844 | $2,000 | $7,844 |
| 2021 | $2,019 | $6,250 | $1,800 | $4,446 |
| 2020 | $1,965 | $6,246 | $1,800 | $4,446 |
| 2019 | $1,987 | $6,246 | $1,800 | $4,446 |
| 2018 | $1,756 | $5,172 | $1,500 | $3,672 |
| 2017 | $1,745 | $5,172 | $1,500 | $3,672 |
| 2016 | $1,758 | $5,170 | $1,500 | $3,670 |
| 2015 | $1,656 | $5,170 | $1,500 | $3,670 |
| 2014 | $1,538 | $5,170 | $1,500 | $3,670 |
| 2013 | -- | $5,170 | $1,500 | $3,670 |
Source: Public Records
Map
Nearby Homes
- 5937 Willard Dr
- 5917 Hagood Ave
- 1112 Yeamans Hall Rd
- 5821 Robinhood Dr
- 5909 Oak St
- 1139 Belvedere Dr
- 0 Pine Ct
- 5812 Hume Ave
- 5823 Lakeview Dr
- 5806 Edinburgh Dr
- 1039 Riverview Dr
- 1062 Dominion Dr
- 1121 Inverness Ln
- 1149 Brookside Dr
- 1230 Hawthorne Cir
- 1043 Dominion Dr
- 1234 Brookside Dr
- 1114 Melvin Dr
- 5814 Robinson St Unit A,B,C,D
- 5810 Knight St
- 1107 Hawthorne Rd
- 1103 Hawthorne Rd
- 1109 Hawthorne Rd
- 5916 Hagood Ave
- 5918 Hagood Ave
- 5914 Hagood Ave
- 1111 Hawthorne Rd
- 1106 Hawthorne Rd
- 1104 Hawthorne Rd
- 1106 Stratford Rd
- 1108 Stratford Rd
- 1108 Hawthorne Rd
- 5912 Hagood Ave
- 1104 Stratford Rd
- 1110 Stratford Rd
- 5920 Hagood Ave
- 1110 Hawthorne Rd
- 1113 Hawthorne Rd
- 1112 Stratford Rd
- 5935 Willard Dr