
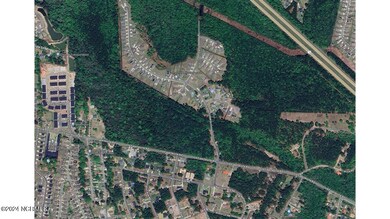
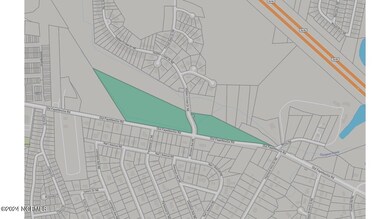
1105 Hidden Creek Dr Leland, NC 28451
Estimated payment $3,773/month
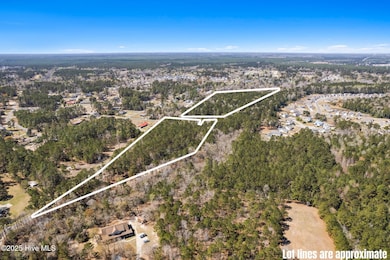
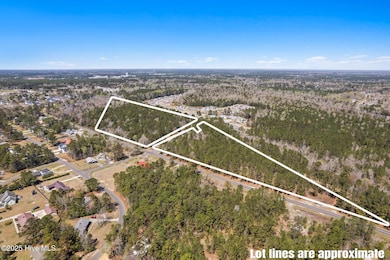
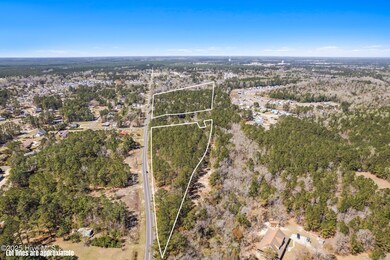
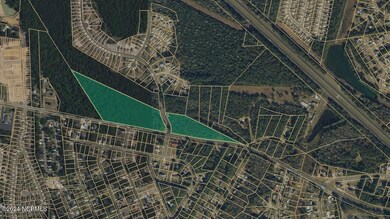
About This Lot
HUGE PRICE REDUCTION! An exceptional investment opportunity at 1105 Hidden Creek Dr., Leland, NC. Ideally located between Hwy 17 and 74. Approximately 3 miles to Leland's shopping hub and approximately 2 miles to 74 making this location quick access to Wilmington. Jr. and Sr. High Schools are within 2 miles.
This 19.68-acre site has
received site plan approval from Brunswick County for 180 multifamily units, making it ideal for an
upscale residential/multifamily development; however, wetlands consideration will determine exactly how many units can be built on this property. Essential utilities, including water and sewer
connections, are conveniently located at the street. 19.68 deeded with 17.5 acre taxed due to ROW. Seize this chance to develop a versatile and highly
desirable property in a rapidly growing area. 4.8 acres wetlands on left back of property. Present usable acres is 12.7. Owner is a Real Estate agent.
Property Details
Property Type
- Land
Lot Details
- Property is zoned R75 & CLD & CO
Schools
- Lincoln Elementary School
- North Brunswick High School
Map
Home Values in the Area
Average Home Value in this Area
Tax History
| Year | Tax Paid | Tax Assessment Tax Assessment Total Assessment is a certain percentage of the fair market value that is determined by local assessors to be the total taxable value of land and additions on the property. | Land | Improvement |
|---|---|---|---|---|
| 2025 | -- | $334,810 | $334,810 | $0 |
| 2024 | $1,185 | $334,810 | $334,810 | $0 |
| 2023 | $1,362 | $334,810 | $334,810 | $0 |
| 2022 | $1,362 | $274,010 | $274,010 | $0 |
| 2021 | $1,362 | $274,010 | $274,010 | $0 |
| 2020 | $1,362 | $274,010 | $274,010 | $0 |
| 2019 | $1,359 | $274,010 | $274,010 | $0 |
| 2018 | $1,335 | $270,060 | $270,060 | $0 |
| 2017 | $1,335 | $270,060 | $270,060 | $0 |
| 2016 | $1,330 | $270,060 | $270,060 | $0 |
| 2015 | $1,330 | $270,060 | $270,060 | $0 |
| 2014 | $1,371 | $305,350 | $305,350 | $0 |
Property History
| Date | Event | Price | List to Sale | Price per Sq Ft |
|---|---|---|---|---|
| 11/21/2025 11/21/25 | Price Changed | $699,000 | -17.8% | -- |
| 08/28/2025 08/28/25 | Price Changed | $850,000 | -29.2% | -- |
| 03/18/2025 03/18/25 | For Sale | $1,200,000 | 0.0% | -- |
| 02/05/2025 02/05/25 | Off Market | $1,200,000 | -- | -- |
| 01/30/2025 01/30/25 | For Sale | $1,200,000 | 0.0% | -- |
| 01/22/2025 01/22/25 | Off Market | $1,200,000 | -- | -- |
| 01/10/2025 01/10/25 | For Sale | $1,200,000 | 0.0% | -- |
| 01/02/2025 01/02/25 | Off Market | $1,200,000 | -- | -- |
| 12/01/2024 12/01/24 | Price Changed | $1,200,000 | +9.1% | -- |
| 12/01/2024 12/01/24 | Price Changed | $1,100,000 | -42.1% | -- |
| 11/11/2024 11/11/24 | For Sale | $1,900,000 | 0.0% | -- |
| 11/02/2024 11/02/24 | Off Market | $1,900,000 | -- | -- |
| 02/06/2024 02/06/24 | For Sale | $1,900,000 | -- | -- |
Purchase History
| Date | Type | Sale Price | Title Company |
|---|---|---|---|
| Commissioners Deed | $22,300 | None Available | |
| Warranty Deed | -- | -- |
Source: Hive MLS
MLS Number: 100426065
APN: 0290009504
Disclaimer: Certain information contained herein is derived from information provided by parties other than Homes.com. All information provided is deemed reliable, but is not guaranteed to be accurate and should be independently verified.
![]() The data relating to real estate on this web site comes in part from the Internet Data Exchange program of Hive MLS LLC. All information is deemed reliable but not guaranteed and should be independently verified. All properties are subject to prior sale, change, or withdrawal. Neither listing broker(s) nor Homesnap, Inc. shall be responsible for any typographical errors, misinformation, or misprints, and shall be held totally harmless from any damages arising from reliance upon these data. ©2025 Hive MLS LLC
The data relating to real estate on this web site comes in part from the Internet Data Exchange program of Hive MLS LLC. All information is deemed reliable but not guaranteed and should be independently verified. All properties are subject to prior sale, change, or withdrawal. Neither listing broker(s) nor Homesnap, Inc. shall be responsible for any typographical errors, misinformation, or misprints, and shall be held totally harmless from any damages arising from reliance upon these data. ©2025 Hive MLS LLC
- 1216 Hidden Creek Dr NE
- 1114 Forest Glen Dr NE Unit Lot 90
- 9329 National Ave NE
- 1288 Hidden Creek Dr NE Unit Lot 65
- 1325 Clancy Dr NE
- 1296 Hidden Creek Dr NE
- 1032 Lexington Ave NE
- 1026 Lexington Ave NE
- 1050 Davidson Ave NE
- 1019 Davidson Ave NE
- 1071 Lexington Ave NE
- 8876 Colbert Place Dr
- 1067 Lexington Ave NE
- 1042 Paddington Ave NE
- 1021 Parkwood Dr NE
- 1247 Dunlop Dr NE
- 9087 National Ave NE Unit 80
- 1534 Selby Ct NE
- 8958 Dale St NE
- 4275 Cobleskill Dr
- 6012 Beckington Dr
- 5019 Mcgarvey Ct
- 7028 Crew Dr
- 6244 Beckington Dr
- 6216 Beckington Dr
- 6208 Beckington Dr
- 6146 Liberty Hall Dr Unit A2
- 6146 Liberty Hall Dr Unit A1
- 6116 Beckington Dr
- 6146 Liberty Hall Dr Unit B1c
- 1108 Veranda Ct
- 868 Rolling Pines Loop Rd NE
- 1105 Wyland Ct
- 9102 Pine Notch Rd
- 1018 Cordgrass Ln
- 304 Bedstone Dr
- 214 Kingsmeadow Cir
- 309 Robin Ct Unit A
- 114 Parsley Ln
- 135 Dresser Ln Unit 9205
