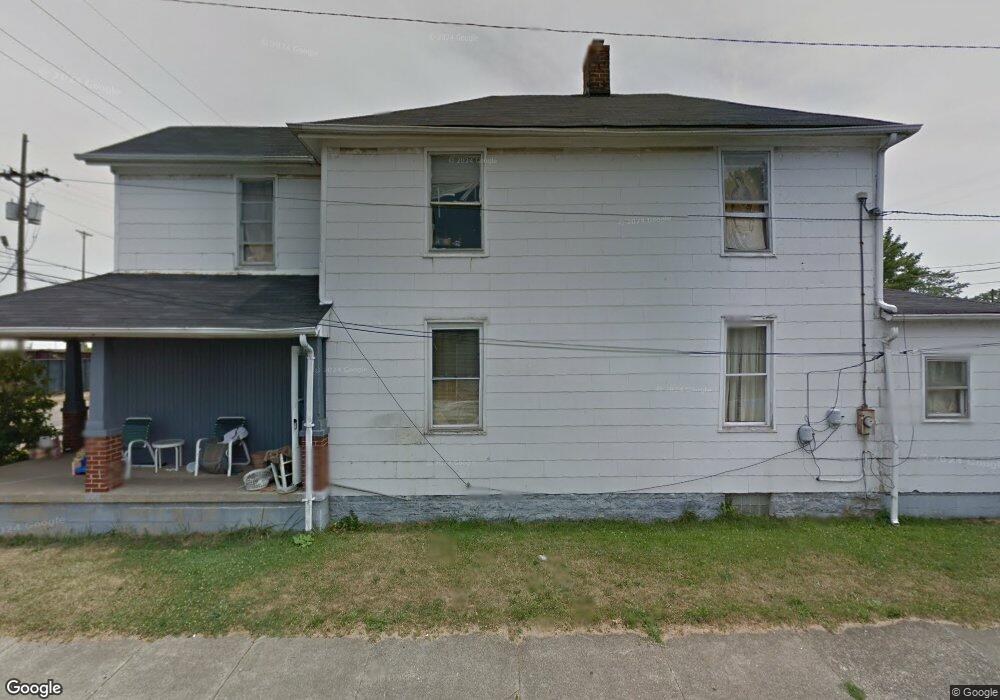
1105 Maple Ave Hamilton, OH 45011
East Hamilton NeighborhoodEstimated Value: $121,000 - $147,401
3
Beds
2
Baths
1,672
Sq Ft
$81/Sq Ft
Est. Value
About This Home
This home is located at 1105 Maple Ave, Hamilton, OH 45011 and is currently estimated at $136,100, approximately $81 per square foot. 1105 Maple Ave is a home located in Butler County with nearby schools including Riverview Elementary School, Garfield Middle School, and Hamilton Freshman School.
Ownership History
Date
Name
Owned For
Owner Type
Purchase Details
Closed on
Oct 20, 2025
Sold by
Mac Group Realty Llc
Bought by
Arrow Homes Llc
Current Estimated Value
Purchase Details
Closed on
Jul 5, 2023
Sold by
Mcfarland Shaun and Mcfarland Heather
Bought by
Mac Group Realty Llc
Home Financials for this Owner
Home Financials are based on the most recent Mortgage that was taken out on this home.
Original Mortgage
$81,250
Interest Rate
6.79%
Mortgage Type
New Conventional
Purchase Details
Closed on
May 20, 2022
Sold by
Muckerheide and Shirley
Bought by
M A C Group Realty Llc
Purchase Details
Closed on
Aug 2, 1999
Sold by
Mirrical Philip O
Bought by
Muckerheide Paul and Muckerheide Shirley
Home Financials for this Owner
Home Financials are based on the most recent Mortgage that was taken out on this home.
Original Mortgage
$45,000
Interest Rate
7.77%
Mortgage Type
Seller Take Back
Create a Home Valuation Report for This Property
The Home Valuation Report is an in-depth analysis detailing your home's value as well as a comparison with similar homes in the area
Home Values in the Area
Average Home Value in this Area
Purchase History
| Date | Buyer | Sale Price | Title Company |
|---|---|---|---|
| Arrow Homes Llc | $150,000 | Absolute Title | |
| Mac Group Realty Llc | -- | None Listed On Document | |
| Mac Group Realty Llc | -- | None Listed On Document | |
| Mcfarland Shaun | -- | None Listed On Document | |
| Mcfarland Shaun | -- | None Listed On Document | |
| M A C Group Realty Llc | $55,000 | Stitsinger Steven M | |
| Muckerheide Paul | $41,800 | -- |
Source: Public Records
Mortgage History
| Date | Status | Borrower | Loan Amount |
|---|---|---|---|
| Previous Owner | Mcfarland Shaun | $81,250 | |
| Previous Owner | Muckerheide Paul | $45,000 |
Source: Public Records
Tax History
| Year | Tax Paid | Tax Assessment Tax Assessment Total Assessment is a certain percentage of the fair market value that is determined by local assessors to be the total taxable value of land and additions on the property. | Land | Improvement |
|---|---|---|---|---|
| 2025 | $815 | $15,160 | $850 | $14,310 |
| 2024 | $815 | $15,170 | $850 | $14,320 |
| 2023 | $732 | $15,170 | $850 | $14,320 |
| 2022 | $742 | $12,130 | $850 | $11,280 |
| 2021 | $620 | $11,660 | $850 | $10,810 |
| 2020 | $642 | $11,660 | $850 | $10,810 |
| 2019 | $401 | $5,480 | $900 | $4,580 |
| 2018 | $340 | $5,480 | $900 | $4,580 |
| 2017 | $342 | $5,480 | $900 | $4,580 |
| 2016 | $333 | $5,050 | $900 | $4,150 |
| 2015 | $254 | $5,050 | $900 | $4,150 |
| 2014 | $597 | $5,050 | $900 | $4,150 |
| 2013 | $597 | $10,980 | $2,170 | $8,810 |
Source: Public Records
Map
Nearby Homes
- 325 S 11th St
- 1114 Chestnut St
- 1232 Chestnut St
- 4890 Harrier Ln
- 706 Ludlow St
- 302 S 7th St
- 36 N 7th St
- 820 Dayton St
- 130 Lulu Ave
- 319 N 11th St
- 75 N Fair Ave
- 1612 Irma Ave
- 623 S Martin Luther King jr Blvd
- 1161 Heaton St
- 712 S 4th St
- 345 Buckeye St
- 325 N Fair Ave
- 430 Long St
- 446 N 6th St
- 334 Hanover St
Your Personal Tour Guide
Ask me questions while you tour the home.