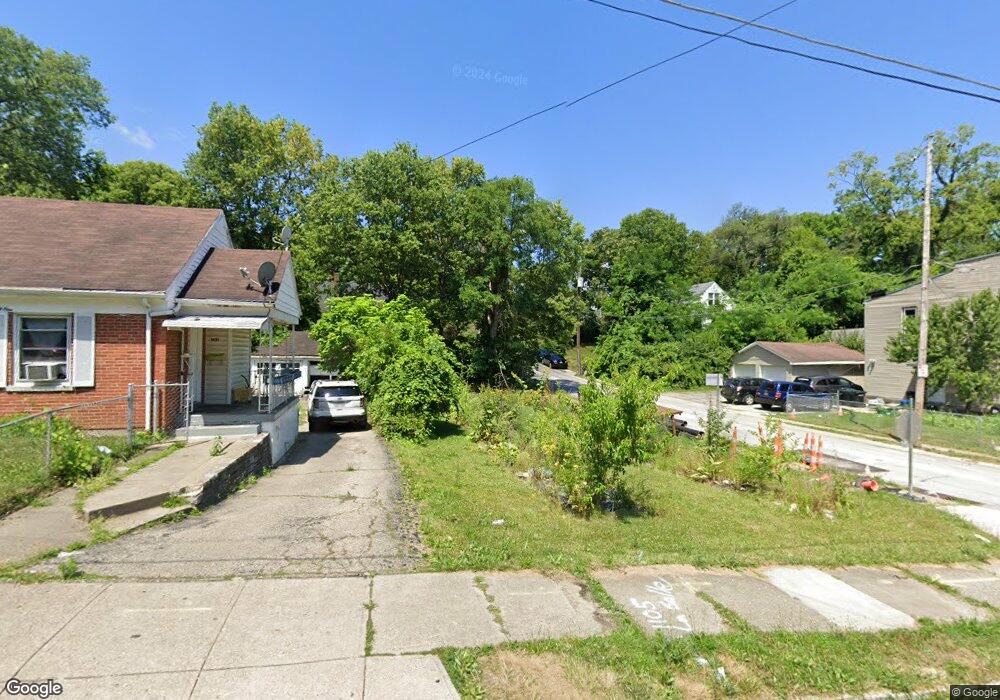
1105 Mcpherson Ave Cincinnati, OH 45205
East Price Hill NeighborhoodEstimated Value: $92,419
2
Beds
1
Bath
1,171
Sq Ft
$79/Sq Ft
Est. Value
About This Home
This home is located at 1105 Mcpherson Ave, Cincinnati, OH 45205 and is currently estimated at $92,419, approximately $78 per square foot. 1105 Mcpherson Ave is a home located in Hamilton County with nearby schools including Gilbert A. Dater High School, Western Hills High School, and Robert A. Taft Information Technology High School.
Ownership History
Date
Name
Owned For
Owner Type
Purchase Details
Closed on
Sep 13, 2018
Sold by
Harbour Portfolio Viii Lp
Bought by
Hamilton County Land Reutilization Corpo
Current Estimated Value
Purchase Details
Closed on
Sep 30, 2013
Sold by
Harbour Portfolio Vii Lp
Bought by
Lakeside Portfolio Management Llc
Purchase Details
Closed on
Jun 26, 2013
Sold by
Federal National Mortgage Association
Bought by
Harbour Portfolio Viii Lp
Purchase Details
Closed on
Dec 18, 2012
Sold by
Toll James and Toll Tonya
Bought by
Federal National Mortgage Association
Purchase Details
Closed on
Jun 7, 2007
Sold by
Fannie Mae
Bought by
Toll Tonya and Toll James
Purchase Details
Closed on
Sep 20, 2006
Sold by
Green Dave and Green Janice
Bought by
Fannie Mae and Federal National Mortgage Association
Purchase Details
Closed on
Dec 3, 2003
Sold by
Ds Real Estate Investments Llc
Bought by
Green Dave
Purchase Details
Closed on
Sep 6, 2002
Sold by
Yount Hobert R
Bought by
Ds Real Estate Investments Llc
Create a Home Valuation Report for This Property
The Home Valuation Report is an in-depth analysis detailing your home's value as well as a comparison with similar homes in the area
Home Values in the Area
Average Home Value in this Area
Purchase History
| Date | Buyer | Sale Price | Title Company |
|---|---|---|---|
| Hamilton County Land Reutilization Corpo | -- | None Available | |
| Lakeside Portfolio Management Llc | $1,000 | -- | |
| Harbour Portfolio Viii Lp | $1,349 | Servicelink Hopewell Campus | |
| Federal National Mortgage Association | $12,000 | Attorney | |
| Toll Tonya | $8,000 | None Available | |
| Fannie Mae | $26,000 | None Available | |
| Green Dave | -- | -- | |
| Ds Real Estate Investments Llc | $42,000 | First Service Title Agency I |
Source: Public Records
Tax History
| Year | Tax Paid | Tax Assessment Tax Assessment Total Assessment is a certain percentage of the fair market value that is determined by local assessors to be the total taxable value of land and additions on the property. | Land | Improvement |
|---|---|---|---|---|
| 2025 | -- | $2,170 | $2,170 | -- |
| 2024 | -- | $2,170 | $2,170 | -- |
| 2023 | $0 | $2,170 | $2,170 | $0 |
| 2022 | $0 | $1,908 | $1,908 | $0 |
| 2021 | $0 | $1,908 | $1,908 | $0 |
| 2020 | $0 | $1,908 | $1,908 | $0 |
| 2019 | $346 | $2,374 | $1,747 | $627 |
| 2018 | $1,242 | $2,374 | $1,747 | $627 |
| 2017 | $1,261 | $2,374 | $1,747 | $627 |
| 2016 | $878 | $7,049 | $1,953 | $5,096 |
| 2015 | $501 | $7,049 | $1,953 | $5,096 |
| 2014 | $504 | $7,049 | $1,953 | $5,096 |
| 2013 | $525 | $7,267 | $2,013 | $5,254 |
Source: Public Records
Map
Nearby Homes
- 1114 Fairbanks Ave
- 966 Fairbanks Ave
- 945 Enright Ave
- 963 Oakland Ave
- 924 Mcpherson Ave
- 3321 Glenway Ave
- 3742 Mayfield Ave
- 3744 Mayfield Ave
- 3320 Glenway Ave
- 945 Oakland Ave
- 903 Mcpherson Ave
- 1015 Purcell Ave
- 1011 Seton Ave
- 952 Seton Ave
- 944 Seton Ave
- 824 Mcpherson Ave
- 3200 Glenway Ave
- 1613 Wyoming Ave
- 812 Fairbanks Ave
- 1030 Considine Ave
- 1051 Mcpherson Ave
- 1049 Mcpherson Ave
- 1111 Mcpherson Ave
- 3611 Lasalle Ave
- 1056 Mcpherson Ave
- 1115 Mcpherson Ave
- 3608 Lasalle Ave
- 1052 Mcpherson Ave
- 1043 Mcpherson Ave
- 3612 Lasalle Ave
- 3617 Lasalle Ave
- 1046 Mcpherson Ave
- 3610 Laclede Ave
- 3616 Lasalle Ave
- 1100 Mcpherson Ave
- 1117 Mcpherson Ave
- 3612 Laclede Ave
- 1039 Mcpherson Ave
- 1044 Mcpherson Ave
- 1116 Mcpherson Ave
Your Personal Tour Guide
Ask me questions while you tour the home.