1105 Merribrook Ln Pearland, TX 77581
Estimated Value: $276,000 - $313,000
3
Beds
2
Baths
1,692
Sq Ft
$174/Sq Ft
Est. Value
About This Home
This home is located at 1105 Merribrook Ln, Pearland, TX 77581 and is currently estimated at $295,139, approximately $174 per square foot. 1105 Merribrook Ln is a home located in Brazoria County with nearby schools including Rustic Oak Elementary School, Pearland Junior High School East, and Alexander Middle School.
Ownership History
Date
Name
Owned For
Owner Type
Purchase Details
Closed on
Dec 27, 2016
Sold by
West James A
Bought by
Jowers Brian T and Jowers Mary Beth
Current Estimated Value
Home Financials for this Owner
Home Financials are based on the most recent Mortgage that was taken out on this home.
Original Mortgage
$163,875
Outstanding Balance
$134,349
Interest Rate
3.94%
Mortgage Type
New Conventional
Estimated Equity
$160,790
Purchase Details
Closed on
Jun 24, 2002
Sold by
Neely Philip E and Neely Connie
Bought by
West James A
Home Financials for this Owner
Home Financials are based on the most recent Mortgage that was taken out on this home.
Original Mortgage
$92,000
Interest Rate
6.78%
Purchase Details
Closed on
May 26, 1998
Sold by
Edwards Laura W and Flynn Laura W
Bought by
Neely Philip E and Neely Connie
Home Financials for this Owner
Home Financials are based on the most recent Mortgage that was taken out on this home.
Original Mortgage
$91,200
Interest Rate
7.22%
Create a Home Valuation Report for This Property
The Home Valuation Report is an in-depth analysis detailing your home's value as well as a comparison with similar homes in the area
Home Values in the Area
Average Home Value in this Area
Purchase History
| Date | Buyer | Sale Price | Title Company |
|---|---|---|---|
| Jowers Brian T | -- | Stewart Title | |
| West James A | -- | Chicago Title | |
| Neely Philip E | -- | Alamo Title Company #30 |
Source: Public Records
Mortgage History
| Date | Status | Borrower | Loan Amount |
|---|---|---|---|
| Open | Jowers Brian T | $163,875 | |
| Previous Owner | West James A | $92,000 | |
| Previous Owner | Neely Philip E | $91,200 |
Source: Public Records
Tax History Compared to Growth
Tax History
| Year | Tax Paid | Tax Assessment Tax Assessment Total Assessment is a certain percentage of the fair market value that is determined by local assessors to be the total taxable value of land and additions on the property. | Land | Improvement |
|---|---|---|---|---|
| 2025 | $4,334 | $268,240 | $21,610 | $246,630 |
| 2023 | $4,334 | $238,201 | $21,610 | $249,160 |
| 2022 | $5,209 | $216,546 | $21,610 | $221,150 |
| 2021 | $5,072 | $196,860 | $17,550 | $179,310 |
| 2020 | $5,032 | $199,250 | $17,550 | $181,700 |
| 2019 | $4,575 | $169,540 | $13,500 | $156,040 |
| 2018 | $4,555 | $169,540 | $13,500 | $156,040 |
| 2017 | $4,578 | $169,540 | $13,500 | $156,040 |
Source: Public Records
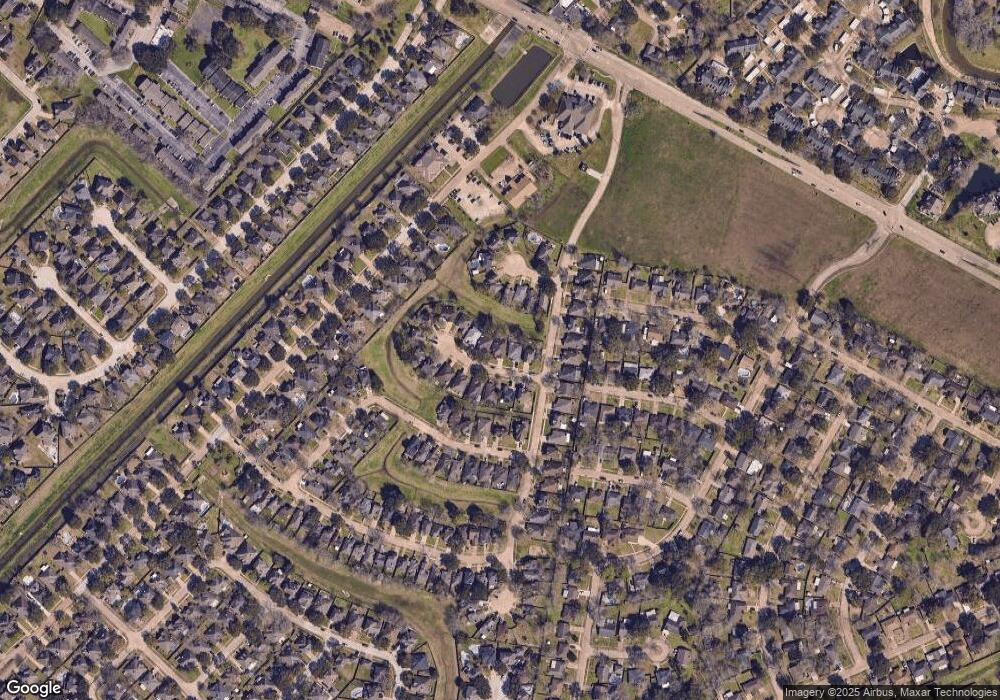
Map
Nearby Homes
- 3613 Pine Valley Dr
- 808 Merribrook Ln
- 515 Brandywyne Dr
- 3901 Kimberly Dr
- 1310 Ainsley Way Dr
- 1211 Woodchase Dr
- 1318 Jamison Pine Dr
- 111 Dunbar Estates Dr Unit 203
- 3910 Kimberly Dr
- 301 Brandywyne Dr
- 2719 Leroy St
- 511 Bellmar Ln
- 514 Bellmar Ln
- 605 Tanglewood Dr
- 1107 Chesterwood Dr
- 502 Bellmar Ln
- 415 Bellmar Ln
- 1108 Chesterwood Dr
- 409 Linda Ln
- 510 Portage Ln
- 1107 Merribrook Ln
- 1103 Merribrook Ln
- 1109 Merribrook Ln
- 1101 Merribrook Ln
- 1111 Merribrook Ln
- 1106 Merribrook Ln
- 1108 Merribrook Ln
- 1104 Merribrook Ln
- 1110 Merribrook Ln
- 1102 Merribrook Ln
- 1108 Camelot Ln
- 1106 Camelot Ln
- 1112 Merribrook Ln
- 1104 Camelot Ln
- 1113 Merribrook Ln
- 1102 Camelot Ln
- 1110 Camelot Ln
- 1114 Merribrook Ln
- 3513 Riverside Dr
- 1115 Merribrook Ln