Home has been totally renovated. New siding, furnace, central air, paint & much more. Laundry room on main floor. Very spacious family room. Full & partial bath on main floor. This home has a lot of new to offer including new kitchen cabinets. Put this one at the top of your list - a must see.
Discover this generously sized 2-story residence at 927 Sycamore Street in Quincy, IL, offering an incredible opportunity for those looking to customize their dream home. Built in 1923, this 3-bedroom, 2-full bathroom house boasts an impressive 5,168 total square feet, providing ample space for comfortable living and entertaining. While livable, this home presents a fantastic canvas for
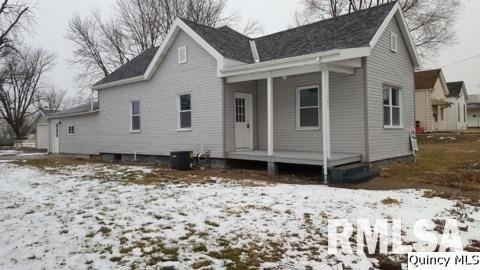
Move In Ready !!! Everything on One Level. Beautiful Hardwood Floors. Open Kitchen/Living Room area. Large Master Bedroom. Large Backyard for plenty of Off-Street Parking plus a 2-car garage. (Metal Roof on Garage) Other Room is Utility. Selling "As Is" - Inspections Welcome. (Refrigerator does not convey) All Measurements are approximate.
This home offers 3 bedrooms and 1 bath. Upon entering, you walk into a nice open living dining area and continue into a spacious kitchen. Bedrooms are nice size with 6x5 walk in closet in master bedroom. Main floor laundry, large attic for extra storage and 6x20 enclosed back porch. There is a deck off the back and 1 car garage that sits on the back alley. A lot of space for a great price!
Lisa HapkeBower & Associates Inc., REALTORS Mt. Sterling
This 3-bedroom, 2 full bath home has over 1800 sq ft that has been mostly updated, including some windows, electrical, paint, kitchen, and both bathrooms. This property has character! There is alley access, with a 2-car garage and a fenced yard. The high efficiency furnace was added in 2019. The property is currently used as a rental. Selling As-Is. 24HR notice required. Owner will package with
Would make a Good Rental Property or a Great Starter Home. Large Rooms. 7' x 30' Rear Covered Porch. Selling "As Is". All measurements are approximate.
Calling all investors and rehabbers! This 3-bedroom, 1-bathroom single-family home offers 1,548 square feet of space just waiting to be brought back to life. Located in the heart of Quincy, this property needs a full renovation—perfect for those looking to flip, rent, or build long-term equity. A major bonus is the huge 3-car detached garage, offering great value for storage or a workshop. This
Welcome home! Adorable 2-bed, 1-bath home. Great south end location. This home features main floor laundry, a detached oversized 2-car garage on the alley. Nice backyard perfect for entertaining. Current owner has loved this home for nearly 30-years! Now it's time for someone else to enjoy it! Brand new water heater installed December 2023. Buyer welcome to any/all inspections, seller is however
Wonderful home, two bedroom could be used as a 3rd, recently remodeled, from plumbing, electric panel, doors, windows, new bathroom, updated kitchen to new appliances and flooring through out. This home is move in ready. HVAC is 5 years old. New hot water heater. New rubber roof on back and gutters. Alley access with 60x38 blacktop lot.
Collateral Analytics
Collateral Analytics AVMs (Automated Valuation Model) employ a number of statistical approaches combined with neighborhood-specific comparable selection guarantees the most up-to-date and precise valuations.
Not Available
Collateral Analytics does not have data for the current month. Please view the chart for historical values.
ICE
ICE Mortgage Technology
ICE Mortgage Technology’s AVM (Automated Valuation Model) is a state-of-the-art online residential property valuation tool that provides a quick and accurate estimate of the value of almost any home in the U.S.
Not Available
ICE Mortgage Technology does not have data for the current month. Please view the chart for historical values.
First American
First American
First American Data & Analytics’ next-generation AVM combines unrivaled data assets with a blended ensemble of valuation models to produce highly accurate, reliable valuations you can trust.
Not Available
First American does not have data for the current month. Please view the chart for historical values.
Quantarium
Quantarium
Quantarium’s valuation service, repeatedly proven the industry’s most accurate and comprehensive, is supercharged with a self-learning and auto-tuning AI engine that continually becomes smarter and more accurate as it processes daily inputs from the industry’s leading RE data lake.
Not Available
Quantarium does not have data for the current month. Please view the chart for historical values.
Average Value
Not Available
List Price
Sold Price
Create a Home Valuation Report for This Property
The Home Valuation Report is an in-depth analysis detailing your home's value as well as a comparison with similar homes in the area
Tax AssessmentTax Assessment
Total Assessment is a certain percentage of the fair market value that is determined by local assessors to be the total taxable value of land and additions on the property.
This home is located at 1105 N 10th St, Quincy, IL 62301 and is currently priced at $89,900. This property was built in 1891. 1105 N 10th St is a home located in Adams County with nearby schools including Iles Elementary School, Quincy Junior High School, and Quincy Senior High School.
Disclaimer: Certain information contained herein is derived from information provided by parties other than Homes.com. All information provided is deemed reliable, but is not guaranteed to be accurate and should be independently verified.
IDX information is provided exclusively for personal, non-commercial use, and may not be used for any purpose other than to identify prospective properties consumers may be interested in purchasing. Information is deemed reliable but not guaranteed.