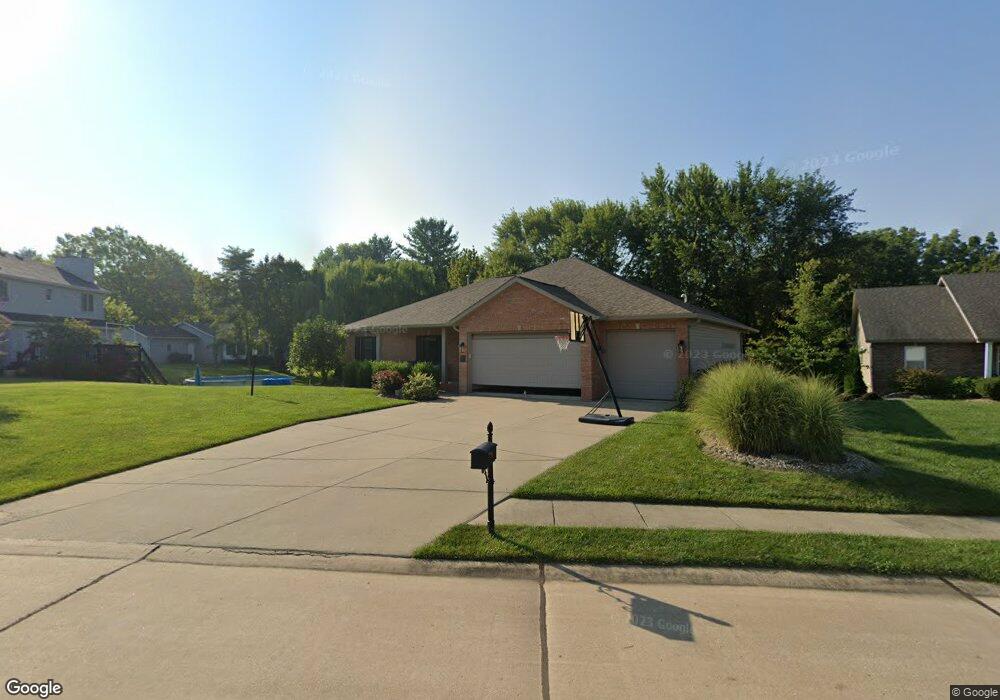
1105 Oak Ln Maryville, IL 62062
Estimated Value: $344,000 - $404,000
3
Beds
2
Baths
1,959
Sq Ft
$188/Sq Ft
Est. Value
About This Home
This home is located at 1105 Oak Ln, Maryville, IL 62062 and is currently estimated at $368,691, approximately $188 per square foot. 1105 Oak Ln is a home located in Madison County with nearby schools including Maryville Elementary School, Dorris Intermediate School, and Collinsville Middle School.
Ownership History
Date
Name
Owned For
Owner Type
Purchase Details
Closed on
Mar 17, 2006
Sold by
Kobylinski Thomas and Kobylinski Kay
Bought by
Wood Phillip M and Wood Marcia A
Current Estimated Value
Home Financials for this Owner
Home Financials are based on the most recent Mortgage that was taken out on this home.
Original Mortgage
$150,000
Outstanding Balance
$85,573
Interest Rate
6.33%
Mortgage Type
Fannie Mae Freddie Mac
Estimated Equity
$283,118
Purchase Details
Closed on
May 19, 2005
Sold by
Lucas Ronald P and Kostyshock Edward R
Bought by
Kobylinski Thomas and Kobylinski Kay
Home Financials for this Owner
Home Financials are based on the most recent Mortgage that was taken out on this home.
Original Mortgage
$200,000
Interest Rate
6.75%
Mortgage Type
Construction
Create a Home Valuation Report for This Property
The Home Valuation Report is an in-depth analysis detailing your home's value as well as a comparison with similar homes in the area
Home Values in the Area
Average Home Value in this Area
Purchase History
| Date | Buyer | Sale Price | Title Company |
|---|---|---|---|
| Wood Phillip M | $231,500 | Abstracts & Titles Inc | |
| Kobylinski Thomas | $46,000 | Abstracts & Titles Inc |
Source: Public Records
Mortgage History
| Date | Status | Borrower | Loan Amount |
|---|---|---|---|
| Open | Wood Phillip M | $150,000 | |
| Previous Owner | Kobylinski Thomas | $200,000 |
Source: Public Records
Tax History Compared to Growth
Tax History
| Year | Tax Paid | Tax Assessment Tax Assessment Total Assessment is a certain percentage of the fair market value that is determined by local assessors to be the total taxable value of land and additions on the property. | Land | Improvement |
|---|---|---|---|---|
| 2024 | $7,051 | $111,210 | $21,040 | $90,170 |
| 2023 | $7,051 | $101,230 | $19,140 | $82,090 |
| 2022 | $6,543 | $93,610 | $17,700 | $75,910 |
| 2021 | $5,900 | $87,950 | $16,630 | $71,320 |
| 2020 | $5,920 | $87,210 | $15,870 | $71,340 |
| 2019 | $5,373 | $79,120 | $15,840 | $63,280 |
| 2018 | $5,236 | $74,960 | $15,010 | $59,950 |
| 2017 | $4,776 | $73,470 | $14,710 | $58,760 |
| 2016 | $5,087 | $73,470 | $14,710 | $58,760 |
| 2015 | $5,085 | $71,560 | $14,330 | $57,230 |
| 2014 | $5,085 | $67,020 | $14,330 | $52,690 |
| 2013 | $5,085 | $71,560 | $14,330 | $57,230 |
Source: Public Records
Map
Nearby Homes
- 501 Drost St
- 1313 Jacquelyn Ct
- 1005 Daniel Dr
- 1014 Daniel Dr
- 1029 Andra Dr
- 29 Dogwood Terrace
- 912 Oakridge Dr
- 137 W Zupan St
- 419 N Donk Ave
- 201 S Lange Ave
- 53 Cheshire Dr
- 2790 Deerfield Dr
- 2723 Keebler Rd
- 6020 Keebler Oaks Dr
- 14 Lou Juan Dr
- 22 Oak Valley Dr
- 104 Summit Ridge Unit 104
- 24 Alta St
- 505 Huntington
- 241 Madison Ave