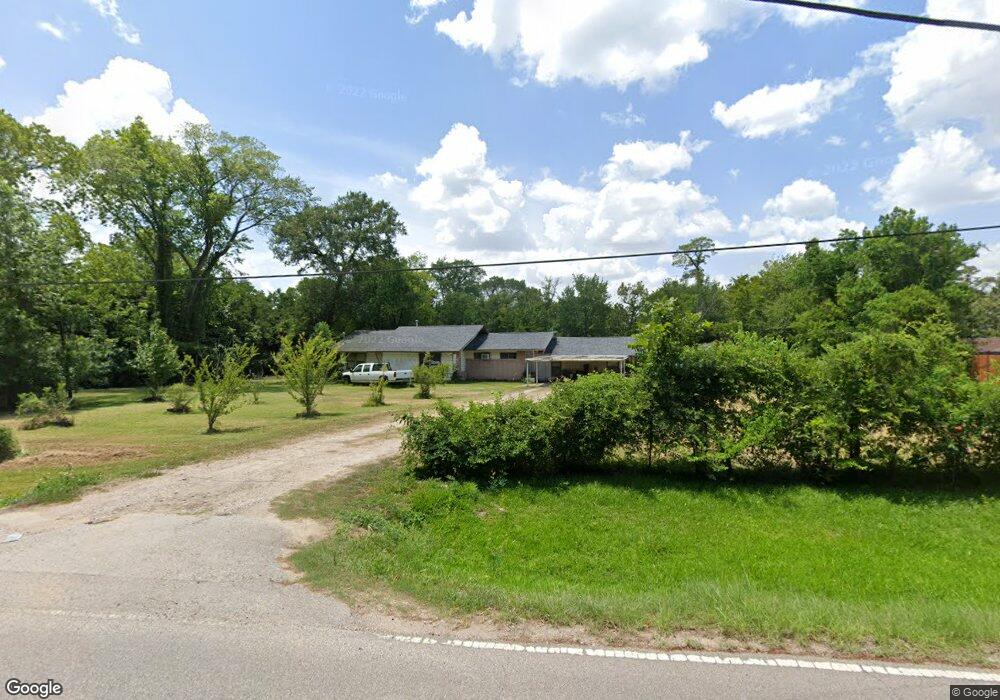
1105 Red Bud St Channelview, TX 77530
Estimated Value: $389,000 - $568,000
3
Beds
2
Baths
1,720
Sq Ft
$257/Sq Ft
Est. Value
About This Home
This home is located at 1105 Red Bud St, Channelview, TX 77530 and is currently estimated at $442,455, approximately $257 per square foot. 1105 Red Bud St is a home located in Harris County with nearby schools including Channelview High School.
Ownership History
Date
Name
Owned For
Owner Type
Purchase Details
Closed on
Oct 20, 1995
Sold by
Ramos Rose M
Bought by
Marker Frank A and Marker Wanda L
Current Estimated Value
Home Financials for this Owner
Home Financials are based on the most recent Mortgage that was taken out on this home.
Original Mortgage
$83,400
Outstanding Balance
$585
Interest Rate
7.6%
Estimated Equity
$441,870
Create a Home Valuation Report for This Property
The Home Valuation Report is an in-depth analysis detailing your home's value as well as a comparison with similar homes in the area
Home Values in the Area
Average Home Value in this Area
Purchase History
| Date | Buyer | Sale Price | Title Company |
|---|---|---|---|
| Marker Frank A | -- | -- |
Source: Public Records
Mortgage History
| Date | Status | Borrower | Loan Amount |
|---|---|---|---|
| Open | Marker Frank A | $83,400 |
Source: Public Records
Tax History Compared to Growth
Tax History
| Year | Tax Paid | Tax Assessment Tax Assessment Total Assessment is a certain percentage of the fair market value that is determined by local assessors to be the total taxable value of land and additions on the property. | Land | Improvement |
|---|---|---|---|---|
| 2025 | $3,353 | $418,936 | $314,870 | $104,066 |
| 2024 | $3,353 | $369,007 | $275,511 | $93,496 |
| 2023 | $3,353 | $382,073 | $275,511 | $106,562 |
| 2022 | $4,989 | $327,957 | $236,153 | $91,804 |
| 2021 | $4,722 | $265,789 | $157,435 | $108,354 |
| 2020 | $4,549 | $223,594 | $141,692 | $81,902 |
| 2019 | $4,230 | $215,812 | $141,692 | $74,120 |
| 2018 | $1,695 | $159,527 | $78,718 | $80,809 |
| 2017 | $3,500 | $159,527 | $78,718 | $80,809 |
| 2016 | $3,181 | $132,808 | $59,038 | $73,770 |
| 2015 | $2,331 | $132,808 | $59,038 | $73,770 |
| 2014 | $2,331 | $100,000 | $59,038 | $40,962 |
Source: Public Records
Map
Nearby Homes
- 0 Laurelwood Dr Unit 43034610
- 16134 Palm St
- 16326 Bear Bayou Dr
- 1211 Pecan St
- 16600 Laurelwood Dr
- 00 Laurelwood Dr
- 16219 Bear Bayou 1 2 Dr
- 16736 Forest Trail Dr
- 1109 Becker St
- 16811 Forest Trail Dr
- 16032 1/2 Ridlon St
- 16023 Ridlon St
- 16121 Bear Bayou Dr Unit 13
- 16931 Avenue B
- 16809 Market St
- 17119 Water Oak Dr
- 108 Cedar Ln
- 16534 Market St
- 16516 Market St
- 17102 River Rd
- 1101 Red Bud St
- 1113 Red Bud St
- 1100 Red Bud St
- 1104 Red Bud St
- 1117 Red Bud St
- 1108 Red Bud St
- 16403 Oak Ln
- 1119 Red Bud St
- 1112 Red Bud St
- 911 Woodland St
- 909 Woodland St
- 914 Red Bud St
- 0 Water Oak Dr Unit 13633840
- 0 Water Oak Dr Unit 4621381
- 0 Water Oak Dr Unit 92060146
- 0 Water Oak Dr Unit 70606502
- 0 Water Oak Dr Unit 99386584
- 0 Water Oak Dr Unit 5817984
- 0 Water Oak Dr Unit 97567249
- 0 Water Oak Dr Unit 95244428