1105 S Front St Wilmington, NC 28401
Dry Pond-South Side NeighborhoodEstimated Value: $192,000 - $329,000
3
Beds
1
Bath
1,055
Sq Ft
$251/Sq Ft
Est. Value
About This Home
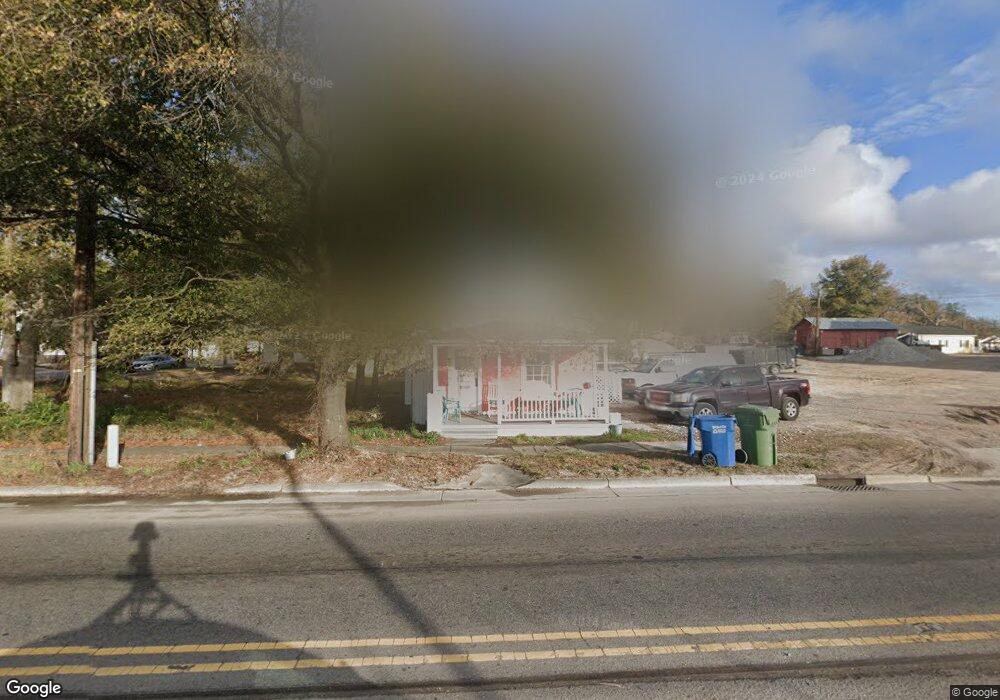
This home is located at 1105 S Front St, Wilmington, NC 28401 and is currently estimated at $264,649, approximately $250 per square foot. 1105 S Front St is a home located in New Hanover County with nearby schools including Snipes Academy of Arts & Design, Williston Middle School, and New Hanover High School.
Ownership History
Date
Name
Owned For
Owner Type
Purchase Details
Closed on
Apr 26, 2021
Sold by
28401 Holdings Llc
Bought by
Bledsoe Michael E
Current Estimated Value
Purchase Details
Closed on
Dec 24, 2020
Sold by
Butler Deborah A and Butler Deborah Armfield
Bought by
28401 Holdings Llc
Purchase Details
Closed on
Jan 1, 2001
Bought by
Pugh Gladys
Purchase Details
Closed on
Jun 7, 1996
Sold by
Secretary Of Hud
Bought by
Butler Deborah A
Purchase Details
Closed on
Mar 7, 1996
Sold by
Hutchens H Terry Sub Trustee
Bought by
Secretary Of Hud
Purchase Details
Closed on
Feb 27, 1995
Sold by
Livingston Robert P
Bought by
Livingston Ii Frederick E
Purchase Details
Closed on
Apr 10, 1991
Sold by
Webb James T
Bought by
Livingston Robert P
Purchase Details
Closed on
Jun 1, 1986
Sold by
Kornegay Lewis Burnice
Bought by
Webb James T
Purchase Details
Closed on
Nov 1, 1983
Sold by
Todd William M
Bought by
Kornegay Lewis Burnice
Purchase Details
Closed on
Feb 1, 1983
Sold by
Pugh Gladys
Bought by
Todd William M
Create a Home Valuation Report for This Property
The Home Valuation Report is an in-depth analysis detailing your home's value as well as a comparison with similar homes in the area
Home Values in the Area
Average Home Value in this Area
Purchase History
| Date | Buyer | Sale Price | Title Company |
|---|---|---|---|
| Bledsoe Michael E | $66,500 | None Available | |
| 28401 Holdings Llc | -- | None Available | |
| Pugh Gladys | -- | -- | |
| Butler Deborah A | -- | -- | |
| Secretary Of Hud | -- | -- | |
| Livingston Ii Frederick E | -- | -- | |
| Livingston Robert P | -- | -- | |
| Webb James T | $30,500 | -- | |
| Kornegay Lewis Burnice | $19,500 | -- | |
| Todd William M | $11,500 | -- |
Source: Public Records
Tax History Compared to Growth
Tax History
| Year | Tax Paid | Tax Assessment Tax Assessment Total Assessment is a certain percentage of the fair market value that is determined by local assessors to be the total taxable value of land and additions on the property. | Land | Improvement |
|---|---|---|---|---|
| 2023 | $1,188 | $136,600 | $39,300 | $97,300 |
| 2022 | $1,169 | $136,600 | $39,300 | $97,300 |
| 2021 | $1,169 | $136,600 | $39,300 | $97,300 |
| 2020 | $713 | $67,700 | $28,600 | $39,100 |
| 2019 | $713 | $67,700 | $28,600 | $39,100 |
| 2018 | $535 | $67,700 | $28,600 | $39,100 |
| 2017 | $713 | $67,700 | $28,600 | $39,100 |
| 2016 | $1,039 | $93,800 | $33,100 | $60,700 |
| 2015 | $993 | $93,800 | $33,100 | $60,700 |
| 2014 | $951 | $93,800 | $33,100 | $60,700 |
Source: Public Records
Map
Nearby Homes