Estimated Value: $972,554
--
Bed
--
Bath
36,760
Sq Ft
$26/Sq Ft
Est. Value
About This Home
This home is located at 1105 SE 2nd St, Galva, IL 61434 and is currently estimated at $972,554, approximately $26 per square foot. 1105 SE 2nd St is a home located in Henry County with nearby schools including Galva Elementary School and Galva Junior/Senior High School.
Ownership History
Date
Name
Owned For
Owner Type
Purchase Details
Closed on
Apr 30, 2024
Sold by
Iron-Vac Truck Sales Llc
Bought by
High Holehouse Realty Llc
Current Estimated Value
Home Financials for this Owner
Home Financials are based on the most recent Mortgage that was taken out on this home.
Original Mortgage
$900,000
Outstanding Balance
$757,643
Interest Rate
6.79%
Mortgage Type
New Conventional
Estimated Equity
$214,911
Purchase Details
Closed on
Aug 24, 2022
Sold by
Illinois Heritage Properties Llc
Bought by
Iron Vac Truck Sales Llc
Purchase Details
Closed on
Dec 5, 2007
Sold by
Kewanee Corp
Bought by
Illinois Heritage Properties Llc
Home Financials for this Owner
Home Financials are based on the most recent Mortgage that was taken out on this home.
Original Mortgage
$133,236
Interest Rate
6.3%
Mortgage Type
Future Advance Clause Open End Mortgage
Create a Home Valuation Report for This Property
The Home Valuation Report is an in-depth analysis detailing your home's value as well as a comparison with similar homes in the area
Home Values in the Area
Average Home Value in this Area
Purchase History
| Date | Buyer | Sale Price | Title Company |
|---|---|---|---|
| High Holehouse Realty Llc | $900,000 | None Listed On Document | |
| Iron Vac Truck Sales Llc | $195,000 | None Listed On Document | |
| Illinois Heritage Properties Llc | $250,000 | None Available |
Source: Public Records
Mortgage History
| Date | Status | Borrower | Loan Amount |
|---|---|---|---|
| Open | High Holehouse Realty Llc | $900,000 | |
| Previous Owner | Illinois Heritage Properties Llc | $133,236 |
Source: Public Records
Tax History Compared to Growth
Tax History
| Year | Tax Paid | Tax Assessment Tax Assessment Total Assessment is a certain percentage of the fair market value that is determined by local assessors to be the total taxable value of land and additions on the property. | Land | Improvement |
|---|---|---|---|---|
| 2024 | $7,132 | $72,022 | $8,797 | $63,225 |
| 2023 | $7,237 | $72,022 | $8,797 | $63,225 |
| 2022 | $7,639 | $72,022 | $8,797 | $63,225 |
| 2021 | $7,565 | $72,022 | $8,797 | $63,225 |
| 2020 | $7,444 | $70,437 | $8,603 | $61,834 |
| 2019 | $7,422 | $72,022 | $8,797 | $63,225 |
| 2018 | $7,466 | $72,022 | $8,797 | $63,225 |
| 2017 | $7,420 | $72,022 | $8,797 | $63,225 |
| 2016 | $7,233 | $68,592 | $8,378 | $60,214 |
| 2015 | $7,185 | $68,592 | $8,378 | $60,214 |
| 2013 | $7,185 | $68,592 | $8,378 | $60,214 |
Source: Public Records
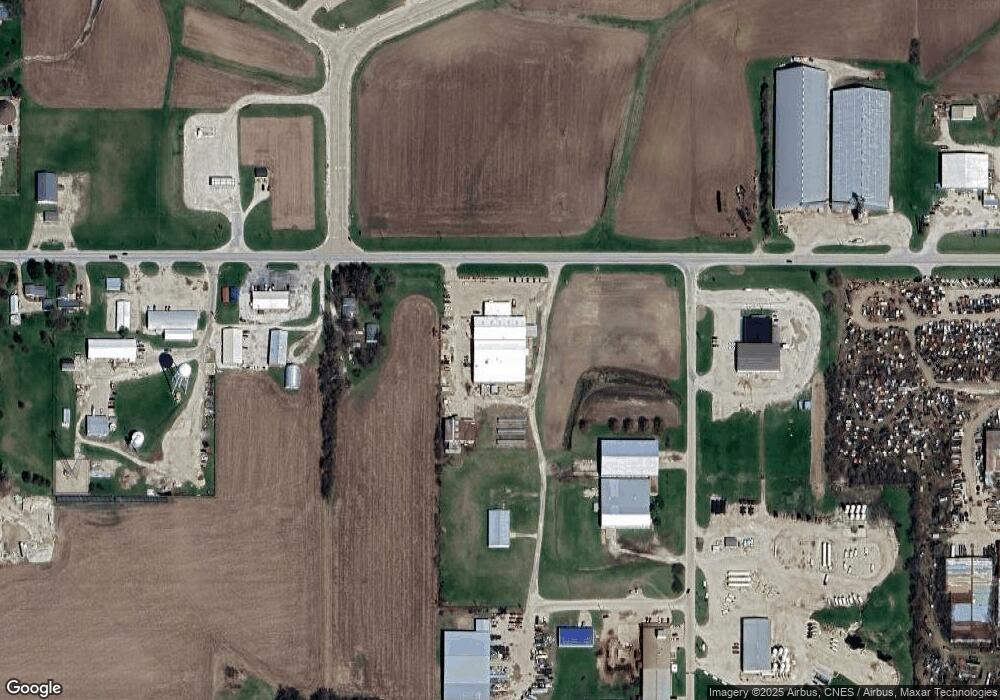
Map
Nearby Homes
- 815 SE 1st St
- 303 NE 2nd St
- 10 NE 1st Ave
- 417 NE 2nd Ave
- 104 Front St
- 416 NW 1st Ave
- 415 SW 4th Ave
- 611 NW 3rd Ave
- 2001 Olof Krans Ave
- 2103 Olof Krans Ave
- 2321 Olof Krans Ave
- 2210 Olof Krans Ave
- 2439 Olof Krans Ave
- 2320 Olof Krans Ave
- 2549 Olof Krans Ave
- 2440 Olof Krans Ave
- 2460 Olof Krans Ave
- 2659 Olof Krans Ave
- 2530 Olof Krans Ave
- 2769 Olof Krans Ave
- 1027 SE 2nd St
- 1103 SE 2nd St
- 1019 SE 2nd St
- 1007 SE 2nd St
- 1206 SE 2nd St
- 921 SE 2nd St
- 929 SE 2nd St
- 921 SE 2nd St
- 927 SE 6th St
- 901 SE 2nd St
- 904 SE 2nd St
- 835 E Division St
- 827 E Division St
- 811 SE 2nd St
- 816 SE 1st St
- 826 E Division St
- 825 E Division St
- 814 SE 1st St
- 824 E Division St
- 809 SE 1st St