Estimated Value: $550,000 - $830,000
Studio
5
Baths
2,480
Sq Ft
$255/Sq Ft
Est. Value
About This Home
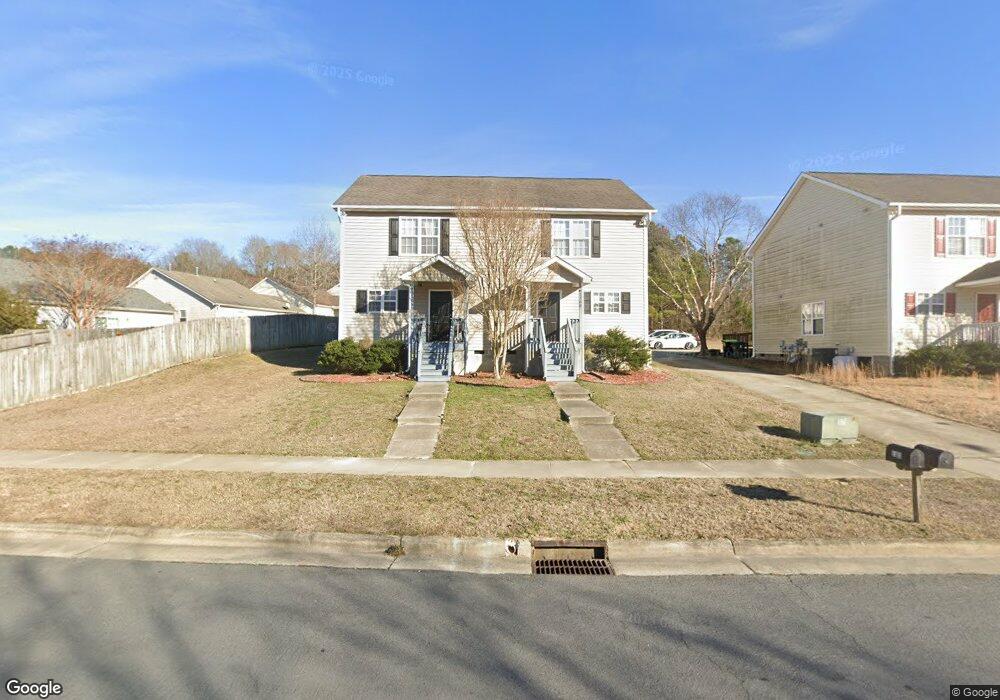
This home is located at 1105 Shackleton Rd Unit 1&2, Apex, NC 27502 and is currently estimated at $633,539, approximately $255 per square foot. 1105 Shackleton Rd Unit 1&2 is a home located in Wake County with nearby schools including Apex Elementary School, Apex Middle, and Apex High School.
Ownership History
Date
Name
Owned For
Owner Type
Purchase Details
Closed on
Oct 2, 2014
Sold by
Kim Cecilia Jung Eun
Bought by
Porter Michael N and Porter Natasha
Current Estimated Value
Purchase Details
Closed on
Feb 27, 2013
Sold by
Kim Nung Dou and Kim Jeong Suk
Bought by
Kim Cecilia Jung Eun
Purchase Details
Closed on
Feb 21, 2013
Sold by
Kim Sung Eun
Bought by
Eun Kim Cecilia Jung
Purchase Details
Closed on
Mar 29, 2010
Sold by
Kim Nung Dou and Kim Jeong Suk
Bought by
Kim Nung Dou and Kim Jeong Suk
Purchase Details
Closed on
Nov 5, 2007
Sold by
Edmunds Alan V and Edmunds Julie A
Bought by
Kim Nung Dou and Kim Jeong Suk
Purchase Details
Closed on
Jul 26, 2004
Sold by
Evans Michael J and Evans Jean M
Bought by
Edmunds Alan and Edmunds Julie A
Home Financials for this Owner
Home Financials are based on the most recent Mortgage that was taken out on this home.
Original Mortgage
$202,500
Interest Rate
6.24%
Mortgage Type
Purchase Money Mortgage
Create a Home Valuation Report for This Property
The Home Valuation Report is an in-depth analysis detailing your home's value as well as a comparison with similar homes in the area
Purchase History
| Date | Buyer | Sale Price | Title Company |
|---|---|---|---|
| Porter Michael N | $225,000 | None Available | |
| Kim Cecilia Jung Eun | -- | None Available | |
| Eun Kim Cecilia Jung | -- | None Available | |
| Kim Nung Dou | -- | None Available | |
| Kim Nung Dou | $231,000 | None Available | |
| Edmunds Alan | $225,000 | -- |
Source: Public Records
Mortgage History
| Date | Status | Borrower | Loan Amount |
|---|---|---|---|
| Previous Owner | Edmunds Alan | $202,500 |
Source: Public Records
Tax History
| Year | Tax Paid | Tax Assessment Tax Assessment Total Assessment is a certain percentage of the fair market value that is determined by local assessors to be the total taxable value of land and additions on the property. | Land | Improvement |
|---|---|---|---|---|
| 2025 | $4,467 | $506,990 | $160,000 | $346,990 |
| 2024 | $4,367 | $506,990 | $160,000 | $346,990 |
| 2023 | $4,023 | $363,117 | $117,000 | $246,117 |
| 2022 | $3,778 | $363,117 | $117,000 | $246,117 |
| 2021 | $3,635 | $363,117 | $117,000 | $246,117 |
| 2020 | $3,599 | $363,117 | $117,000 | $246,117 |
| 2019 | $2,950 | $256,243 | $87,500 | $168,743 |
| 2018 | $2,780 | $256,243 | $87,500 | $168,743 |
| 2017 | $2,590 | $256,243 | $87,500 | $168,743 |
| 2016 | $2,552 | $256,243 | $87,500 | $168,743 |
| 2015 | $2,499 | $244,826 | $60,000 | $184,826 |
| 2014 | -- | $244,826 | $60,000 | $184,826 |
Source: Public Records
Map
Nearby Homes
- 1039 Dual Parks Rd
- 305 Anterbury Dr
- 110 Anterbury Dr
- 0-2932 Tingen Rd
- 101 Harbor Haven Dr
- 1750 Minley Way
- 318 Glaston Ct
- 1434 Salem Creek Dr
- 1639 Padstone Dr
- 1614 Brussels Dr
- 120 Licorice Dr
- 102 Licorice Dr
- 203 Milky Way Dr
- 1787 Flint Valley Ln
- 1840 Flint Valley Ln
- 314 Wrenn St
- 736 Treviso Ln
- 111 Lemon Drop Cir
- 1008 Daresbury Dr
- 307 S Elm St
- 1105 Shackleton Rd
- 1103 Shackleton Rd Unit 5
- 1107 Shackleton Rd
- 1047 Dual Parks Rd
- 1049 Dual Parks Rd
- 1045 Dual Parks Rd
- 1051 Dual Parks Rd
- 1043 Dual Parks Rd
- 1041 Dual Parks Rd
- 1106 Shackleton Rd
- 1104 Shackleton Rd
- 1108 Shackleton Rd
- 1100 Shackleton Rd
- 1110 Shackleton Rd
- 1048 Dual Park
- 1048 Dual Parks Rd
- 1044 Dual Parks Rd
- 1001 Lexington Farm Rd
- 1050 Dual Parks Rd
- 1044 Dual Park
Your Personal Tour Guide
Ask me questions while you tour the home.