1105 Substation Rd Brunswick, OH 44212
Estimated Value: $269,452 - $288,000
3
Beds
7
Baths
1,572
Sq Ft
$178/Sq Ft
Est. Value
About This Home
This home is located at 1105 Substation Rd, Brunswick, OH 44212 and is currently estimated at $280,363, approximately $178 per square foot. 1105 Substation Rd is a home located in Medina County with nearby schools including Hickory Ridge Elementary School, Willets Middle School, and Brunswick High School.
Ownership History
Date
Name
Owned For
Owner Type
Purchase Details
Closed on
Oct 19, 2006
Sold by
Conroy Jeffrey A
Bought by
Conroy Jennifer R
Current Estimated Value
Purchase Details
Closed on
Dec 9, 2005
Sold by
Conroy Jeffrey A and Conroy Jennifer R
Bought by
Bosak Robert A and Bosak Denine M
Home Financials for this Owner
Home Financials are based on the most recent Mortgage that was taken out on this home.
Original Mortgage
$76,000
Interest Rate
6.2%
Mortgage Type
Purchase Money Mortgage
Purchase Details
Closed on
Nov 8, 2005
Sold by
Conroy Jeffrey A and Conroy Jennifer R
Bought by
Conroy Jeffrey A and Conroy Jennifer R
Home Financials for this Owner
Home Financials are based on the most recent Mortgage that was taken out on this home.
Original Mortgage
$76,000
Interest Rate
6.2%
Mortgage Type
Purchase Money Mortgage
Purchase Details
Closed on
Oct 10, 2002
Sold by
Joreski Jennifer R and Conroy Jeffrey A
Bought by
Conroy Jeffrey A and Conroy Jennifer R
Create a Home Valuation Report for This Property
The Home Valuation Report is an in-depth analysis detailing your home's value as well as a comparison with similar homes in the area
Home Values in the Area
Average Home Value in this Area
Purchase History
| Date | Buyer | Sale Price | Title Company |
|---|---|---|---|
| Conroy Jennifer R | -- | -- | |
| Bosak Robert A | $103,500 | None Available | |
| Conroy Jeffrey A | -- | -- | |
| Conroy Jeffrey A | -- | -- |
Source: Public Records
Mortgage History
| Date | Status | Borrower | Loan Amount |
|---|---|---|---|
| Previous Owner | Bosak Robert A | $76,000 |
Source: Public Records
Tax History
| Year | Tax Paid | Tax Assessment Tax Assessment Total Assessment is a certain percentage of the fair market value that is determined by local assessors to be the total taxable value of land and additions on the property. | Land | Improvement |
|---|---|---|---|---|
| 2024 | $4,050 | $63,820 | $30,660 | $33,160 |
| 2023 | $3,608 | $63,820 | $30,660 | $33,160 |
| 2022 | $3,427 | $63,820 | $30,660 | $33,160 |
| 2021 | $3,043 | $49,860 | $23,950 | $25,910 |
| 2020 | $2,765 | $49,860 | $23,950 | $25,910 |
| 2019 | $2,766 | $49,860 | $23,950 | $25,910 |
| 2018 | $2,585 | $44,870 | $18,130 | $26,740 |
| 2017 | $2,589 | $44,870 | $18,130 | $26,740 |
| 2016 | $2,587 | $44,870 | $18,130 | $26,740 |
| 2015 | $2,431 | $42,330 | $17,110 | $25,220 |
| 2014 | $2,426 | $42,330 | $17,110 | $25,220 |
| 2013 | $2,430 | $42,330 | $17,110 | $25,220 |
Source: Public Records
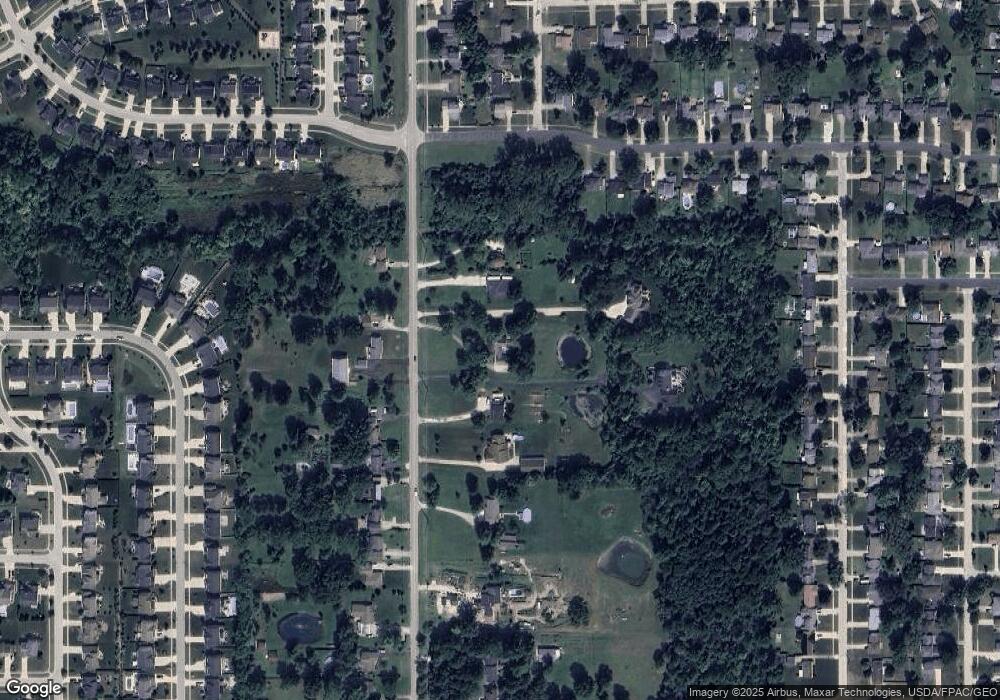
Map
Nearby Homes
- 1125 Substation Rd
- 998 Woodfield Ln
- 4776 Aspen Oval
- 4633 Hickory Ridge Ave
- 4628 Wolff Dr
- 803 Substation Rd
- 0 Terrington Dr Unit 4467162
- 1390 Mussel Shoals Dr
- 1394 Mussel Shoals Dr
- V/L 0.344 AC Walnut Ridge Ave
- 4619 Center Rd
- V/L 0.69 AC Walnut Ridge Ave
- 5035 Center Rd
- V/L 0.347 AC Walnut Ridge Ave
- 1416 Spyglass Hill Dr
- 5206 Yorton Ln
- 5101 Center Rd
- 5265 Bringham Dr
- 1424 Roosevelt Ave
- 5220 Center Rd
- 1095 Substation Rd
- 1121 Substation Rd
- 1110 Substation Rd
- 1110 Substation Rd
- 1085 Substation Rd
- 1100 Substation Rd
- 1145 Substation Rd
- 1134 Substation Rd
- 1099 Substation Rd
- 1144 Substation Rd
- 1080 Substation Rd
- 1150 Substation Rd
- 4802 Wolff Dr
- 1165 Substation Rd
- 2499 Substation Rd
- 4796 Wolff Dr
- 4788 Wolff Dr
- 1168 Substation Rd
- 4780 Wolff Dr
- 1158 Substation Rd
Your Personal Tour Guide
Ask me questions while you tour the home.