Estimated Value: $197,354 - $218,000
3
Beds
2
Baths
1,291
Sq Ft
$158/Sq Ft
Est. Value
About This Home
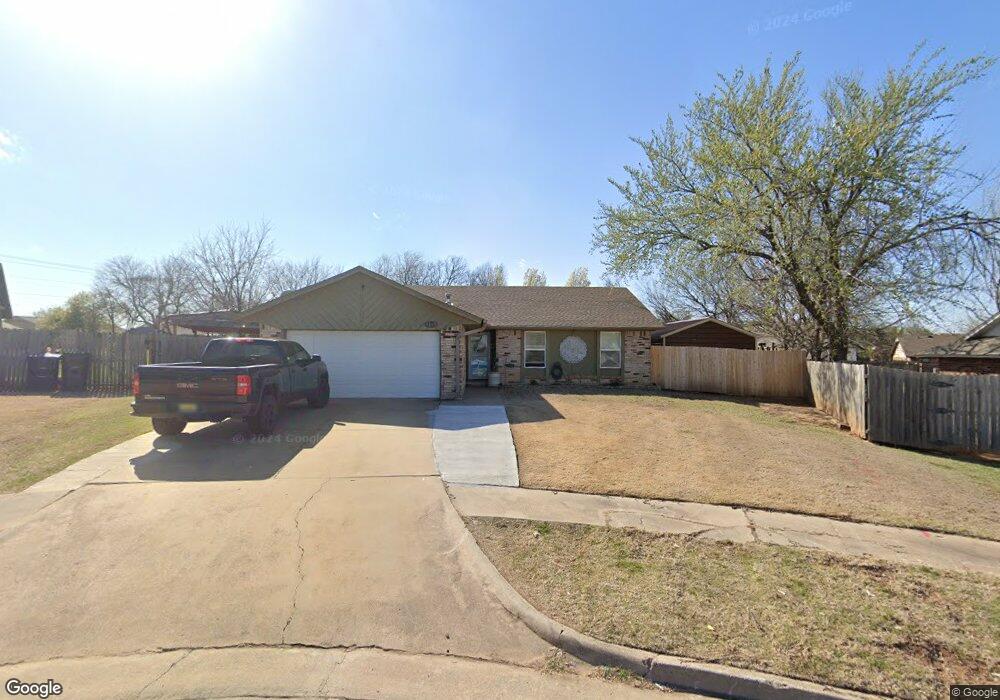
This home is located at 1105 Teak Ct, Moore, OK 73160 and is currently estimated at $203,839, approximately $157 per square foot. 1105 Teak Ct is a home located in Cleveland County with nearby schools including Apple Creek Elementary School, Highland East Junior High School, and Moore High School.
Ownership History
Date
Name
Owned For
Owner Type
Purchase Details
Closed on
Sep 28, 2011
Sold by
Wells Fargo Bank Na
Bought by
Rhodes Brenda L
Current Estimated Value
Home Financials for this Owner
Home Financials are based on the most recent Mortgage that was taken out on this home.
Original Mortgage
$92,089
Outstanding Balance
$62,199
Interest Rate
4.28%
Mortgage Type
FHA
Estimated Equity
$141,640
Purchase Details
Closed on
Apr 5, 2011
Sold by
Finley Steven
Bought by
Wachovia Mortgage Fsb and World Savings Bank
Purchase Details
Closed on
Jun 28, 2006
Sold by
Lemons Christopher R and Lemons Gracie M
Bought by
Finley Steven and Kitchen Nichole
Home Financials for this Owner
Home Financials are based on the most recent Mortgage that was taken out on this home.
Original Mortgage
$71,216
Interest Rate
6.58%
Mortgage Type
New Conventional
Create a Home Valuation Report for This Property
The Home Valuation Report is an in-depth analysis detailing your home's value as well as a comparison with similar homes in the area
Home Values in the Area
Average Home Value in this Area
Purchase History
| Date | Buyer | Sale Price | Title Company |
|---|---|---|---|
| Rhodes Brenda L | $65,000 | Buffalo Land Title | |
| Wachovia Mortgage Fsb | -- | None Available | |
| Finley Steven | $110,000 | None Available |
Source: Public Records
Mortgage History
| Date | Status | Borrower | Loan Amount |
|---|---|---|---|
| Open | Rhodes Brenda L | $92,089 | |
| Previous Owner | Finley Steven | $71,216 |
Source: Public Records
Tax History
| Year | Tax Paid | Tax Assessment Tax Assessment Total Assessment is a certain percentage of the fair market value that is determined by local assessors to be the total taxable value of land and additions on the property. | Land | Improvement |
|---|---|---|---|---|
| 2025 | $1,836 | $15,996 | $3,393 | $12,603 |
| 2024 | $1,762 | $15,530 | $3,425 | $12,105 |
| 2023 | $1,717 | $15,078 | $3,214 | $11,864 |
| 2022 | $1,688 | $14,639 | $3,440 | $11,199 |
| 2021 | $1,642 | $14,212 | $2,220 | $11,992 |
| 2020 | $1,643 | $14,212 | $2,220 | $11,992 |
| 2019 | $1,673 | $14,212 | $2,220 | $11,992 |
| 2018 | $1,630 | $13,878 | $2,168 | $11,710 |
| 2017 | $1,588 | $14,213 | $0 | $0 |
| 2016 | $1,549 | $13,081 | $2,043 | $11,038 |
| 2015 | $1,357 | $12,700 | $2,141 | $10,559 |
| 2014 | $1,345 | $12,330 | $1,380 | $10,950 |
Source: Public Records
Map
Nearby Homes
- 1105 Spruce Dr
- 1009 Ashwood Ln
- 624 Whispering Oaks Blvd
- 2013 Wimberley Creek Dr
- 2025 Wimberley Creek Dr
- 517 Cottonwood Dr
- 1517 SE 6th St
- 2113 SE 8th St
- 2200 SE 8th St
- 1101 S English St
- 2100 SE 5th St
- 2433 SE 12th St
- 2304 SE 5th St
- 401 S Bryant Ave
- 813 S Avery St
- 1809 Parkway Dr
- 708 S Avery Dr
- 801 S Avery Dr
- 1117 Kelsi Dr
- 901 SE 12th St
Your Personal Tour Guide
Ask me questions while you tour the home.