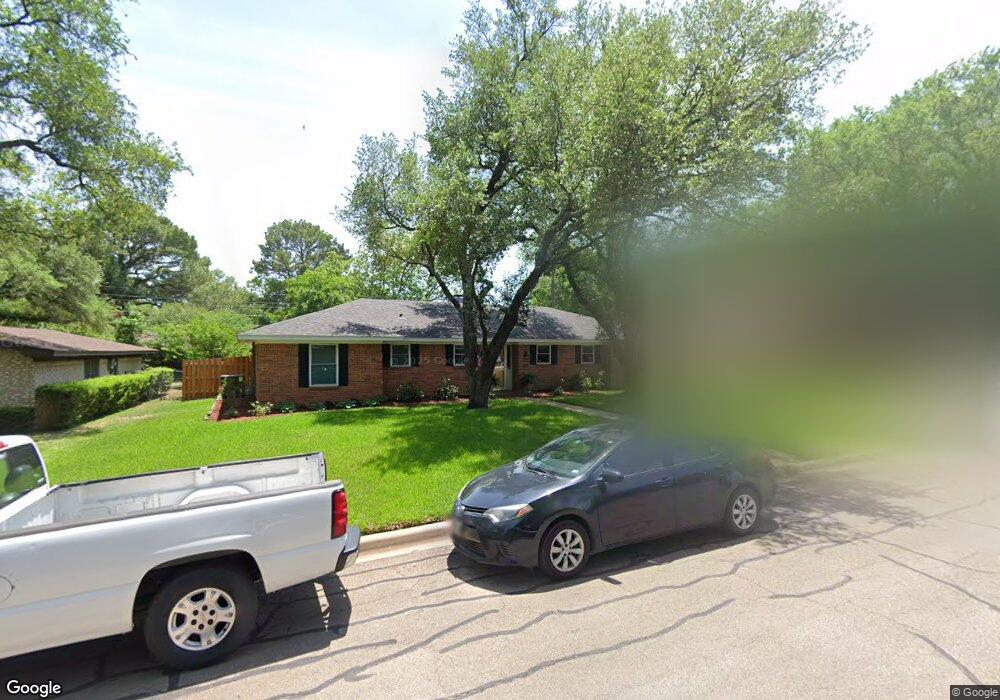
1105 Trace Rd Cleburne, TX 76033
Estimated Value: $279,767 - $295,000
3
Beds
2
Baths
1,813
Sq Ft
$159/Sq Ft
Est. Value
About This Home
This home is located at 1105 Trace Rd, Cleburne, TX 76033 and is currently estimated at $287,942, approximately $158 per square foot. 1105 Trace Rd is a home located in Johnson County with nearby schools including Coleman Elementary School, Lowell Smith Jr. Middle School, and Cleburne High School.
Ownership History
Date
Name
Owned For
Owner Type
Purchase Details
Closed on
Aug 15, 2017
Sold by
Kiggins Sondra
Bought by
Hodges Robert Wayne and Hodges Joyce Joan
Current Estimated Value
Purchase Details
Closed on
Jul 25, 2008
Sold by
Prudential Relocation Inc
Bought by
West Marc A and West Rebecca
Home Financials for this Owner
Home Financials are based on the most recent Mortgage that was taken out on this home.
Original Mortgage
$138,461
Interest Rate
6.47%
Mortgage Type
Purchase Money Mortgage
Purchase Details
Closed on
May 6, 2008
Sold by
Roewe Randall Allen and Roewe Terri Tanner
Bought by
Prudential Relocation Inc
Home Financials for this Owner
Home Financials are based on the most recent Mortgage that was taken out on this home.
Original Mortgage
$100,400
Interest Rate
6.07%
Mortgage Type
Purchase Money Mortgage
Create a Home Valuation Report for This Property
The Home Valuation Report is an in-depth analysis detailing your home's value as well as a comparison with similar homes in the area
Home Values in the Area
Average Home Value in this Area
Purchase History
| Date | Buyer | Sale Price | Title Company |
|---|---|---|---|
| Hodges Robert Wayne | -- | None Available | |
| West Marc A | -- | Alamo Title Company | |
| Prudential Relocation Inc | -- | Alamo Title Company |
Source: Public Records
Mortgage History
| Date | Status | Borrower | Loan Amount |
|---|---|---|---|
| Previous Owner | West Marc A | $138,461 | |
| Previous Owner | Prudential Relocation Inc | $100,400 |
Source: Public Records
Tax History
| Year | Tax Paid | Tax Assessment Tax Assessment Total Assessment is a certain percentage of the fair market value that is determined by local assessors to be the total taxable value of land and additions on the property. | Land | Improvement |
|---|---|---|---|---|
| 2025 | $3,846 | $277,139 | $65,000 | $212,139 |
| 2024 | $5,245 | $235,248 | $0 | $0 |
| 2023 | $3,394 | $277,139 | $65,000 | $212,139 |
| 2022 | $4,866 | $235,279 | $55,000 | $180,279 |
| 2021 | $4,611 | $209,401 | $45,000 | $164,401 |
| 2020 | $4,452 | $160,677 | $30,000 | $130,677 |
| 2019 | $4,748 | $160,679 | $30,000 | $130,679 |
| 2018 | $4,533 | $160,679 | $30,000 | $130,679 |
| 2017 | $4,104 | $139,405 | $25,000 | $114,405 |
| 2016 | $3,811 | $129,460 | $25,000 | $104,460 |
Source: Public Records
Map
Nearby Homes
- 1108 Trace Rd
- 1114 Willowcreek Rd
- 1116 Willowcreek Rd
- 1002 Berkley Dr
- 4112 Highland Dr
- 1204 W Westhill Dr
- 840 S Ridgeway Dr
- 1211 Greenbriar Ln
- 1005 Hemphill Dr
- 1225 Crestwood Dr
- 1208 Cindy Ln
- 832 Featherston St
- 1104 Cherrywood Dr
- 1123 Berkley Dr
- 502 Bellevue Dr
- 1303 Glenhaven Dr
- 616 Bellevue Dr
- 505 Bellevue Dr
- 107 Sunset Dr
- 1304 Bradley Ct
- 1107 Trace Rd
- 1401 Trace Rd
- 1106 Willowcreek Rd
- 1104 Willowcreek Rd
- 1109 Trace Rd
- 1102 Trace Rd
- 1104 Trace Rd
- 1102 Willowcreek Rd
- 808 Berkley Dr
- 1108 Willowcreek Rd
- 1106 Trace Rd
- 804 Berkley Dr
- 1111 Trace Rd
- 810 Berkley Dr
- 1110 Willowcreek Rd
- 802 Berkley Dr
- 1107 Willowcreek Rd
- 1105 Willowcreek Rd
- 1110 Trace Rd
- 1109 Willowcreek Rd
Your Personal Tour Guide
Ask me questions while you tour the home.