D
Seller's Agent in 2016
Dennis Becker
Inactive Office
Estimated Value: $172,545 - $197,000
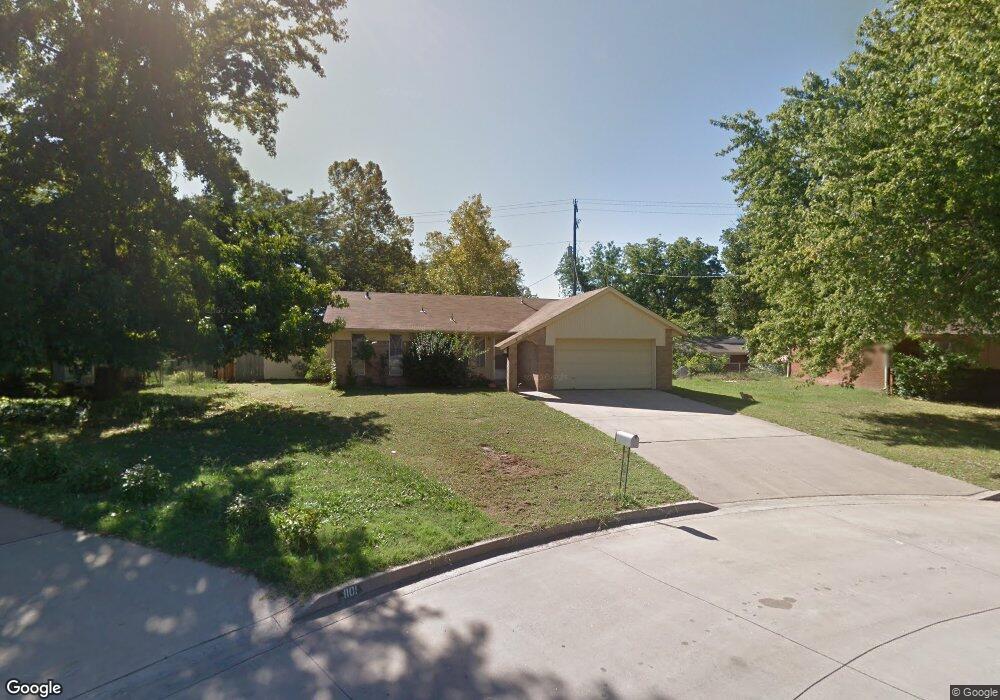
Cul de sac lot. Low Maintenance brick with vinyl siding. 3 bedrooms, 1.5 bath. 2 car attached garage. Inground pool.
Last Agent to Sell the Property
Dennis Becker
Inactive Office License #106464 Listed on: 02/26/2016
| Date | Buyer | Sale Price | Title Company |
|---|---|---|---|
| Blake Kevin | -- | None Available | |
| Frye Mattbew E | -- | None Available | |
| Frye Matthew E | $87,000 | None Available | |
| The J A Hardison Revocable Living Trust | -- | None Available |
| Date | Status | Borrower | Loan Amount |
|---|---|---|---|
| Previous Owner | Frye Matthew E | $85,424 |
| Date | Event | Price | List to Sale | Price per Sq Ft |
|---|---|---|---|---|
| 05/02/2016 05/02/16 | Sold | $56,100 | -9.2% | $47 / Sq Ft |
| 02/26/2016 02/26/16 | Pending | -- | -- | -- |
| 02/26/2016 02/26/16 | For Sale | $61,800 | -- | $52 / Sq Ft |
| Year | Tax Paid | Tax Assessment Tax Assessment Total Assessment is a certain percentage of the fair market value that is determined by local assessors to be the total taxable value of land and additions on the property. | Land | Improvement |
|---|---|---|---|---|
| 2025 | $1,083 | $11,713 | $2,413 | $9,300 |
| 2024 | $1,031 | $11,155 | $1,980 | $9,175 |
| 2023 | $1,031 | $10,624 | $1,980 | $8,644 |
| 2022 | $978 | $10,563 | $1,980 | $8,583 |
| 2021 | $958 | $10,848 | $1,980 | $8,868 |
| 2020 | $978 | $10,679 | $1,980 | $8,699 |
| 2019 | $998 | $10,772 | $1,980 | $8,792 |
| 2018 | $1,037 | $11,223 | $1,980 | $9,243 |
| 2017 | $1,020 | $11,108 | $1,980 | $9,128 |
| 2016 | $1,019 | $10,860 | $1,980 | $8,880 |
| 2015 | $981 | $10,584 | $1,980 | $8,604 |
| 2014 | $990 | $10,673 | $1,980 | $8,693 |
D
Seller's Agent in 2016
Dennis Becker
Inactive Office

Buyer's Agent in 2016
Lisa Rogers
McGraw, REALTORS
(918) 289-9393
1 in this area
64 Total Sales
Source: MLS Technology
MLS Number: 1604372
APN: 660007791
Disclaimer: Certain information contained herein is derived from information provided by parties other than Homes.com. All information provided is deemed reliable, but is not guaranteed to be accurate and should be independently verified.
![]() IDX information is provided exclusively for personal, non-commercial use, and may not be used for any purpose other than to identify prospective properties consumers may be interested in purchasing.
IDX information is provided exclusively for personal, non-commercial use, and may not be used for any purpose other than to identify prospective properties consumers may be interested in purchasing.
Information is deemed reliable but not guaranteed.