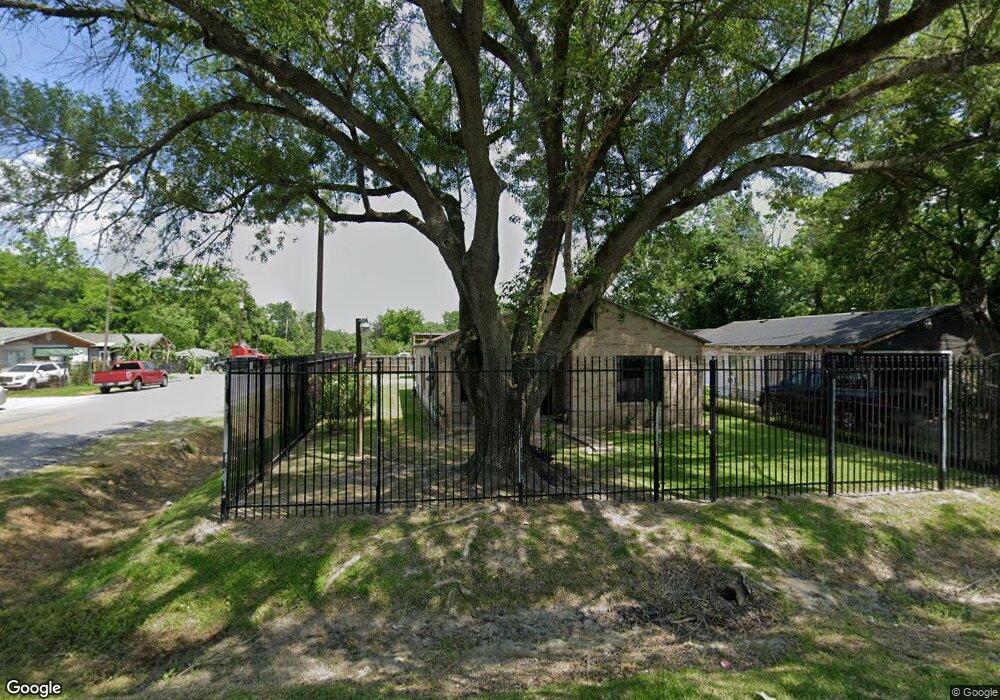
11050 Epsom Rd Houston, TX 77093
East Aldine NeighborhoodEstimated Value: $139,000 - $178,000
2
Beds
1
Bath
1,409
Sq Ft
$107/Sq Ft
Est. Value
About This Home
This home is located at 11050 Epsom Rd, Houston, TX 77093 and is currently estimated at $150,228, approximately $106 per square foot. 11050 Epsom Rd is a home located in Harris County with nearby schools including Escamilla Elementary School, Macarthur Ninth Grade School, and Hambrick Middle School.
Ownership History
Date
Name
Owned For
Owner Type
Purchase Details
Closed on
Jun 13, 2014
Sold by
Gonzalez Martha M and Gonzalez Martha
Bought by
Garcia Maria
Current Estimated Value
Purchase Details
Closed on
Dec 18, 2002
Sold by
Casida Roger A and Casida Katherine
Bought by
Gonzalez Martha and Garcia Maria
Home Financials for this Owner
Home Financials are based on the most recent Mortgage that was taken out on this home.
Original Mortgage
$58,500
Interest Rate
6.05%
Purchase Details
Closed on
Jan 6, 1997
Sold by
Nationsbank Of Louisville Ky
Bought by
Williams David
Purchase Details
Closed on
Jan 5, 1997
Sold by
Casida Roger A and Casida Katherine D
Bought by
Medina Ernesto and Medina Maria I
Purchase Details
Closed on
Jul 19, 1994
Sold by
Takacs Julius and Takacs Esther
Bought by
Casida Roger A and Casida Katherine Delores
Create a Home Valuation Report for This Property
The Home Valuation Report is an in-depth analysis detailing your home's value as well as a comparison with similar homes in the area
Home Values in the Area
Average Home Value in this Area
Purchase History
| Date | Buyer | Sale Price | Title Company |
|---|---|---|---|
| Garcia Maria | -- | None Available | |
| Gonzalez Martha | -- | Commonwealth Land Title Co | |
| Williams David | -- | -- | |
| Medina Ernesto | -- | -- | |
| Casida Roger A | -- | -- | |
| Casida Roger A | -- | -- |
Source: Public Records
Mortgage History
| Date | Status | Borrower | Loan Amount |
|---|---|---|---|
| Previous Owner | Gonzalez Martha | $58,500 |
Source: Public Records
Tax History Compared to Growth
Tax History
| Year | Tax Paid | Tax Assessment Tax Assessment Total Assessment is a certain percentage of the fair market value that is determined by local assessors to be the total taxable value of land and additions on the property. | Land | Improvement |
|---|---|---|---|---|
| 2025 | $544 | $128,083 | $26,469 | $101,614 |
| 2024 | $544 | $96,150 | $26,469 | $69,681 |
| 2023 | $544 | $91,999 | $26,469 | $65,530 |
| 2022 | $1,200 | $82,698 | $15,125 | $67,573 |
| 2021 | $1,143 | $53,040 | $13,613 | $39,427 |
| 2020 | $1,205 | $53,040 | $13,613 | $39,427 |
| 2019 | $1,262 | $53,040 | $13,613 | $39,427 |
| 2018 | $762 | $53,040 | $13,613 | $39,427 |
| 2017 | $1,202 | $53,040 | $13,613 | $39,427 |
| 2016 | $1,202 | $53,040 | $13,613 | $39,427 |
| 2015 | $917 | $53,040 | $13,613 | $39,427 |
| 2014 | $917 | $53,040 | $13,613 | $39,427 |
Source: Public Records
Map
Nearby Homes
- 4410 Shelton Rd
- 11206 Eastex Fwy
- 3804 Cedar Hill Ln
- 4415 Mooney Rd
- 3418 Hopper Rd
- 4007 Wedgewood St
- 4918 Langley Rd
- 4809 Edgewater Dr
- 1904 Little York Rd
- 9213 Washington St
- 11375 Allwood St
- 3214 Brea Crest St
- 4509 Haywood St
- 5022 Bretshire Dr
- 5130 Farb Dr
- 1728 Little York Rd
- 4522 Collins Rd
- 5123 Francine Ln
- 5611 Yorkwood St
- 0 Cedar Hill Ln Unit 45497108
- 11046 Epsom Rd
- 4114 Lone Oak Rd
- 4118 Lone Oak Rd
- 4109 Lone Oak Rd
- 4113 Lone Oak Rd
- 4005 Trenton Rd
- 4122 Lone Oak Rd
- 11049 Epsom Rd Unit 1
- 4015 Trenton Rd
- 11039 Epsom Rd
- 11039 Epsom Rd
- 4019 Trenton Rd
- 4126 Lone Oak Rd
- 4121 Lone Oak Rd
- 4023 Trenton Rd
- 11048 Eastex Fwy
- 11044 Eastex Fwy
- 4125 Lone Oak Rd
- 4128 Lone Oak Rd
- 4208 Cedar Hill Ln