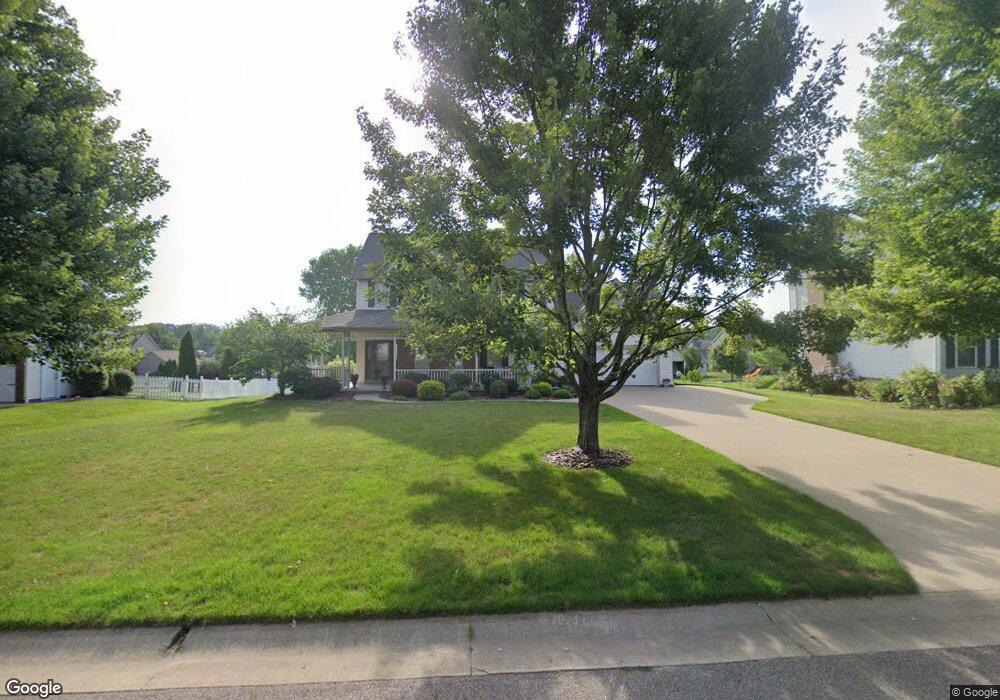
11052 Bancroft Ave NW Uniontown, OH 44685
Estimated Value: $379,000 - $396,000
4
Beds
3
Baths
2,336
Sq Ft
$165/Sq Ft
Est. Value
About This Home
This home is located at 11052 Bancroft Ave NW, Uniontown, OH 44685 and is currently estimated at $385,007, approximately $164 per square foot. 11052 Bancroft Ave NW is a home located in Stark County with nearby schools including North Canton Middle School, Hoover High School, and Mayfair Christian School.
Ownership History
Date
Name
Owned For
Owner Type
Purchase Details
Closed on
Apr 10, 2024
Sold by
Earles Jennifer L and Hampton Jennifer L
Bought by
Earles Jennifer L
Current Estimated Value
Purchase Details
Closed on
May 6, 2003
Sold by
Hampton Douglas E and Hampton Jennifer L
Bought by
Hampton Jennifer L
Purchase Details
Closed on
Nov 22, 2000
Sold by
Olson Dallas P and Olson Susan M
Bought by
Hampton Douglas E and Earles Jennifer L
Home Financials for this Owner
Home Financials are based on the most recent Mortgage that was taken out on this home.
Original Mortgage
$218,153
Interest Rate
7.22%
Mortgage Type
Purchase Money Mortgage
Purchase Details
Closed on
Oct 5, 1999
Sold by
Colonial Homes Inc
Bought by
Olson Dallas P and Olson Susan M
Home Financials for this Owner
Home Financials are based on the most recent Mortgage that was taken out on this home.
Original Mortgage
$130,900
Interest Rate
6.37%
Mortgage Type
Purchase Money Mortgage
Purchase Details
Closed on
Sep 3, 1998
Sold by
Chatham Dev Corp
Bought by
Colonial Homes Inc
Create a Home Valuation Report for This Property
The Home Valuation Report is an in-depth analysis detailing your home's value as well as a comparison with similar homes in the area
Home Values in the Area
Average Home Value in this Area
Purchase History
| Date | Buyer | Sale Price | Title Company |
|---|---|---|---|
| Earles Jennifer L | -- | None Listed On Document | |
| Hampton Jennifer L | -- | -- | |
| Hampton Douglas E | $224,900 | -- | |
| Olson Dallas P | $212,900 | -- | |
| Colonial Homes Inc | $43,900 | -- |
Source: Public Records
Mortgage History
| Date | Status | Borrower | Loan Amount |
|---|---|---|---|
| Previous Owner | Hampton Douglas E | $218,153 | |
| Previous Owner | Olson Dallas P | $130,900 |
Source: Public Records
Tax History Compared to Growth
Tax History
| Year | Tax Paid | Tax Assessment Tax Assessment Total Assessment is a certain percentage of the fair market value that is determined by local assessors to be the total taxable value of land and additions on the property. | Land | Improvement |
|---|---|---|---|---|
| 2025 | -- | $108,050 | $22,120 | $85,930 |
| 2024 | -- | $108,050 | $22,120 | $85,930 |
| 2023 | $5,263 | $98,600 | $18,690 | $79,910 |
| 2022 | $2,525 | $98,600 | $18,690 | $79,910 |
| 2021 | $5,194 | $98,600 | $18,690 | $79,910 |
| 2020 | $4,980 | $86,320 | $16,140 | $70,180 |
| 2019 | $4,664 | $86,320 | $16,140 | $70,180 |
| 2018 | $4,830 | $86,320 | $16,140 | $70,180 |
| 2017 | $4,214 | $79,250 | $17,330 | $61,920 |
| 2016 | $4,230 | $79,250 | $17,330 | $61,920 |
| 2015 | $4,247 | $79,250 | $17,330 | $61,920 |
| 2014 | $1,908 | $68,960 | $15,090 | $53,870 |
| 2013 | $1,955 | $68,960 | $15,090 | $53,870 |
Source: Public Records
Map
Nearby Homes
- 11065 Dunsby Ave NW
- 11056 Peach Glen Ave NW
- 3851 Cromford Cir NW
- 3863 Heckman St NW
- 3475 Heckman St NW
- 11316 Cleveland Ave NW
- 0 Heckman St NW Unit 5154708
- 4943 Mayfair Rd
- 10380 Sudbury Cir NW
- 4786 Mayfair Rd
- 10531 Newbury Ave NW
- 3048 Wright Rd NW
- 3026 Wright Rd NW
- 2845 Byron Dr
- 10044 Cleveland Ave NW
- Sarasota Plan at Spring Hill - Spring Hill Villas
- Chester Plan at Spring Hill - Spring Hill Villas
- Kenai Plan at Spring Hill - Spring Hill Villas
- Holston Plan at Spring Hill - Spring Hill Villas
- Bradbern Plan at Spring Hill - Spring Hill Villas
- 11034 Bancroft Ave NW
- 11068 Bancroft Ave NW
- 11037 Dunsby Ave NW
- 11016 Bancroft Ave NW
- 11090 Bancroft Ave NW
- 11019 Dunsby Ave NW
- 11055 Dunsby Ave NW
- 11025 Bancroft Ave NW
- 11045 Bancroft Ave NW
- 10999 Dunsby Ave NW
- 11063 Bancroft Ave NW
- 10996 Bancroft Ave NW
- 11108 Bancroft Ave NW
- 11081 Bancroft Ave NW
- 11005 Bancroft Ave NW
- 10977 Dunsby Ave NW
- 11093 Dunsby Ave NW
- 11099 Bancroft Ave NW
- 3859 Aylesworth Ave NW
- 10989 Bancroft Ave NW