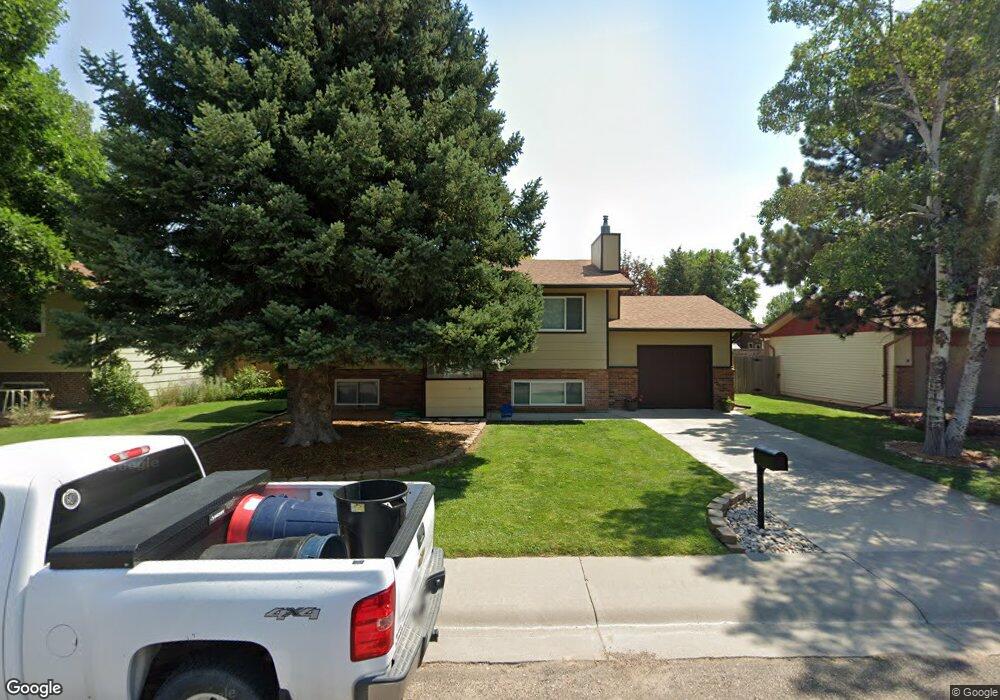
1106 21st St Wheatland, WY 82201
Estimated Value: $282,000 - $329,000
4
Beds
2
Baths
1,904
Sq Ft
$159/Sq Ft
Est. Value
About This Home
This home is located at 1106 21st St, Wheatland, WY 82201 and is currently estimated at $302,476, approximately $158 per square foot. 1106 21st St is a home located in Platte County.
Ownership History
Date
Name
Owned For
Owner Type
Purchase Details
Closed on
Nov 15, 2023
Sold by
Stenson Cory L and Stenson Tamara M
Bought by
Cory And Tamara Stenson Living Trust and Stenson
Current Estimated Value
Purchase Details
Closed on
Aug 15, 2019
Sold by
Lubeck Terry L and Lubeck Nancy K
Bought by
Stenson Cory L and Stenson Tamara M
Home Financials for this Owner
Home Financials are based on the most recent Mortgage that was taken out on this home.
Original Mortgage
$207,100
Interest Rate
3.8%
Mortgage Type
New Conventional
Create a Home Valuation Report for This Property
The Home Valuation Report is an in-depth analysis detailing your home's value as well as a comparison with similar homes in the area
Home Values in the Area
Average Home Value in this Area
Purchase History
| Date | Buyer | Sale Price | Title Company |
|---|---|---|---|
| Cory And Tamara Stenson Living Trust | -- | None Listed On Document | |
| Stenson Cory L | -- | None Available |
Source: Public Records
Mortgage History
| Date | Status | Borrower | Loan Amount |
|---|---|---|---|
| Previous Owner | Stenson Cory L | $207,100 |
Source: Public Records
Tax History Compared to Growth
Tax History
| Year | Tax Paid | Tax Assessment Tax Assessment Total Assessment is a certain percentage of the fair market value that is determined by local assessors to be the total taxable value of land and additions on the property. | Land | Improvement |
|---|---|---|---|---|
| 2025 | $1,944 | $21,047 | $1,687 | $19,360 |
| 2024 | $1,944 | $26,630 | $2,163 | $24,467 |
| 2023 | $1,917 | $26,256 | $1,912 | $24,344 |
| 2022 | $1,706 | $22,451 | $1,912 | $20,539 |
| 2021 | $1,545 | $20,331 | $1,804 | $18,527 |
| 2020 | $1,470 | $19,347 | $1,804 | $17,543 |
| 2019 | $1,454 | $19,252 | $1,804 | $17,448 |
| 2018 | $1,385 | $18,346 | $1,804 | $16,542 |
| 2017 | $1,345 | $17,821 | $1,804 | $16,017 |
| 2016 | $1,249 | $16,544 | $1,804 | $14,740 |
| 2015 | $1,085 | $15,293 | $1,804 | $13,489 |
| 2014 | $1,085 | $14,416 | $1,804 | $12,612 |
Source: Public Records
Map
Nearby Homes