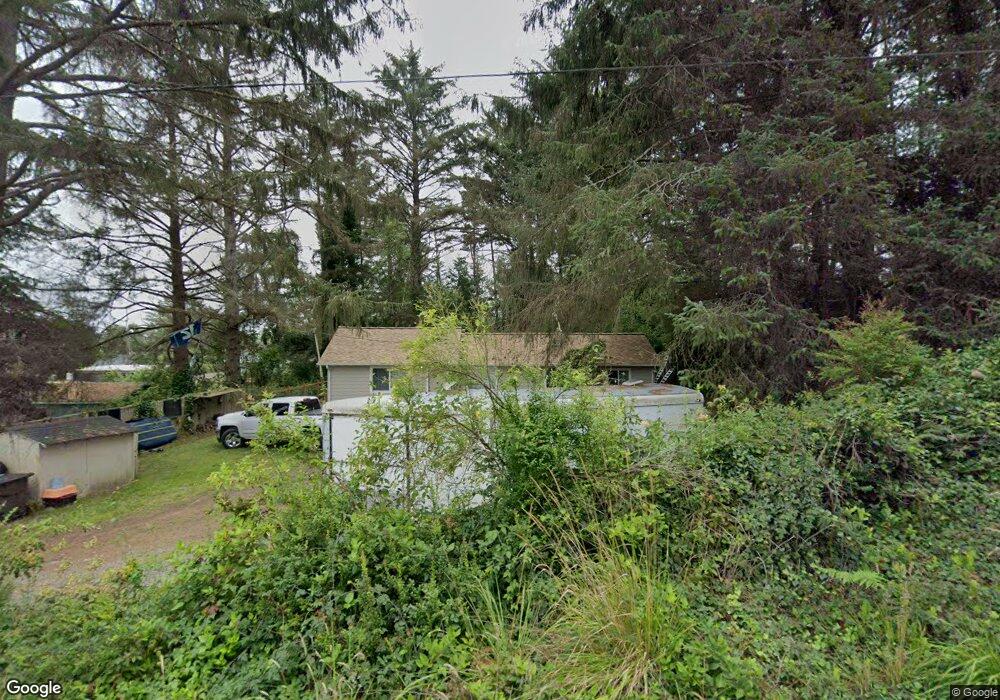
1106 274th Place Ocean Park, WA 98640
Estimated Value: $312,000 - $382,000
3
Beds
2
Baths
1,144
Sq Ft
$310/Sq Ft
Est. Value
About This Home
This home is located at 1106 274th Place, Ocean Park, WA 98640 and is currently estimated at $354,781, approximately $310 per square foot. 1106 274th Place is a home with nearby schools including Ilwaco Senior High School.
Ownership History
Date
Name
Owned For
Owner Type
Purchase Details
Closed on
Mar 11, 2024
Sold by
Kendall-Bray Andrew M and Kendall-Bray Carla J
Bought by
Holden Patricia L and Holden Mark G
Current Estimated Value
Purchase Details
Closed on
Aug 30, 2019
Sold by
Kendall Bray Andrew M and Holden Patricia L
Bought by
Kendall Bray Andrew M and Kendall Bray Carla J
Home Financials for this Owner
Home Financials are based on the most recent Mortgage that was taken out on this home.
Original Mortgage
$100,000
Interest Rate
3.7%
Mortgage Type
Credit Line Revolving
Create a Home Valuation Report for This Property
The Home Valuation Report is an in-depth analysis detailing your home's value as well as a comparison with similar homes in the area
Home Values in the Area
Average Home Value in this Area
Purchase History
| Date | Buyer | Sale Price | Title Company |
|---|---|---|---|
| Holden Patricia L | $148,000 | None Listed On Document | |
| Kendall Bray Andrew M | -- | Pacific County Title Company |
Source: Public Records
Mortgage History
| Date | Status | Borrower | Loan Amount |
|---|---|---|---|
| Previous Owner | Kendall Bray Andrew M | $100,000 |
Source: Public Records
Tax History Compared to Growth
Tax History
| Year | Tax Paid | Tax Assessment Tax Assessment Total Assessment is a certain percentage of the fair market value that is determined by local assessors to be the total taxable value of land and additions on the property. | Land | Improvement |
|---|---|---|---|---|
| 2025 | $2,492 | $312,600 | $117,000 | $195,600 |
| 2024 | $2,492 | $344,600 | $129,000 | $215,600 |
| 2023 | $2,289 | $288,500 | $108,000 | $180,500 |
| 2022 | $2,193 | $200,400 | $75,000 | $125,400 |
| 2021 | $2,096 | $176,300 | $66,000 | $110,300 |
| 2020 | $2,059 | $160,300 | $60,000 | $100,300 |
| 2019 | $1,959 | $151,600 | $65,000 | $86,600 |
| 2018 | $2,157 | $141,200 | $65,000 | $76,200 |
| 2017 | $1,981 | $141,200 | $65,000 | $76,200 |
| 2015 | $1,898 | $141,200 | $65,000 | $76,200 |
| 2014 | -- | $134,300 | $65,000 | $69,300 |
| 2012 | -- | $146,200 | $65,000 | $81,200 |
Source: Public Records
Map
Nearby Homes