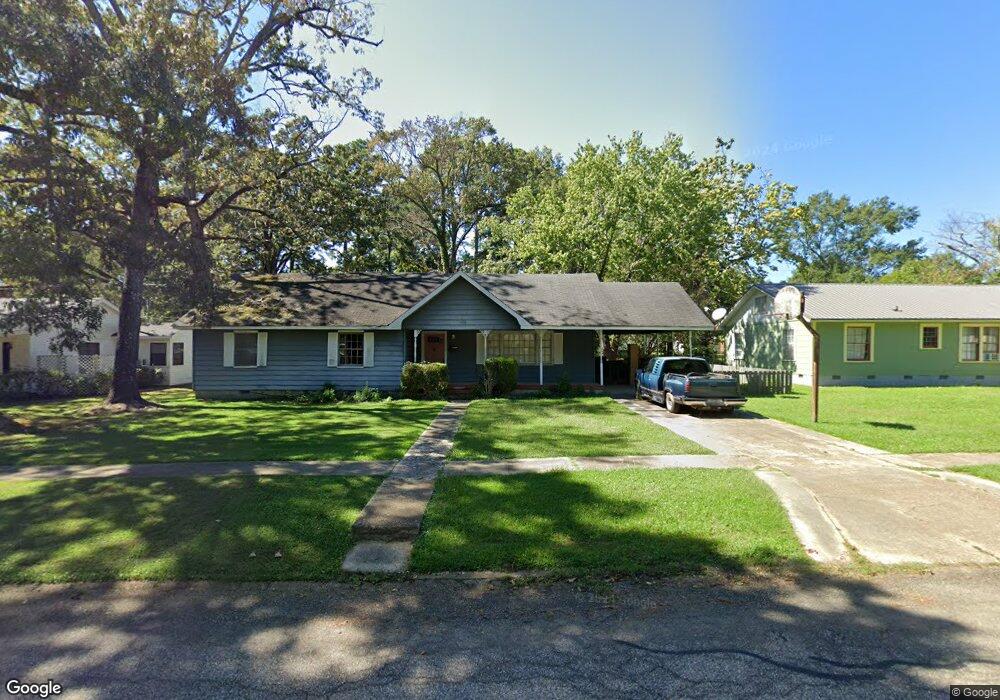
1106 Beech St Crossett, AR 71635
Estimated Value: $114,000 - $193,000
--
Bed
2
Baths
1,872
Sq Ft
$74/Sq Ft
Est. Value
About This Home
This home is located at 1106 Beech St, Crossett, AR 71635 and is currently estimated at $138,375, approximately $73 per square foot. 1106 Beech St is a home located in Ashley County with nearby schools including Crossett Elementary School, Crossett Middle School, and Crossett High School.
Ownership History
Date
Name
Owned For
Owner Type
Purchase Details
Closed on
May 4, 2023
Sold by
Johnson Derek Lee
Bought by
Four Walls Investment Group
Current Estimated Value
Home Financials for this Owner
Home Financials are based on the most recent Mortgage that was taken out on this home.
Original Mortgage
$80,000
Outstanding Balance
$25,223
Interest Rate
6.32%
Mortgage Type
Construction
Estimated Equity
$113,152
Purchase Details
Closed on
Dec 14, 2022
Sold by
Johnson Teri Denise
Bought by
Johnson Derek Lee and Johnson Kelly Denise
Purchase Details
Closed on
May 10, 2019
Sold by
Johnson Gregory N
Bought by
Johnson Teri D
Purchase Details
Closed on
Nov 21, 1995
Bought by
Johnson Gregory N and Johnson Teri D
Purchase Details
Closed on
Nov 9, 1992
Bought by
Campbell Glenda Fisk
Purchase Details
Closed on
Apr 4, 1969
Bought by
Campbell Scott Lawson and Campbell Glenda
Purchase Details
Closed on
Oct 15, 1966
Bought by
Sawner Thomas Edgar and Sawner Doris B
Create a Home Valuation Report for This Property
The Home Valuation Report is an in-depth analysis detailing your home's value as well as a comparison with similar homes in the area
Home Values in the Area
Average Home Value in this Area
Purchase History
| Date | Buyer | Sale Price | Title Company |
|---|---|---|---|
| Four Walls Investment Group | $35,000 | Mills Title | |
| Four Walls Investment Group | $35,000 | Mills Title | |
| Johnson Derek Lee | -- | -- | |
| Johnson Teri D | -- | None Available | |
| Johnson Gregory N | $64,000 | -- | |
| Campbell Glenda Fisk | -- | -- | |
| Campbell Scott Lawson | -- | -- | |
| Sawner Thomas Edgar | -- | -- |
Source: Public Records
Mortgage History
| Date | Status | Borrower | Loan Amount |
|---|---|---|---|
| Open | Four Walls Investment Group | $80,000 | |
| Closed | Four Walls Investment Group | $80,000 |
Source: Public Records
Tax History Compared to Growth
Tax History
| Year | Tax Paid | Tax Assessment Tax Assessment Total Assessment is a certain percentage of the fair market value that is determined by local assessors to be the total taxable value of land and additions on the property. | Land | Improvement |
|---|---|---|---|---|
| 2025 | $1,061 | $19,630 | $1,200 | $18,430 |
| 2024 | $1,061 | $19,630 | $1,200 | $18,430 |
| 2023 | $1,061 | $19,630 | $1,200 | $18,430 |
| 2022 | $181 | $10,280 | $1,200 | $9,080 |
| 2021 | $181 | $10,280 | $1,200 | $9,080 |
| 2020 | $181 | $10,280 | $1,200 | $9,080 |
| 2019 | $181 | $10,280 | $1,200 | $9,080 |
| 2018 | $206 | $10,280 | $1,200 | $9,080 |
| 2017 | $396 | $13,790 | $1,500 | $12,290 |
| 2016 | $340 | $13,790 | $1,500 | $12,290 |
| 2015 | $340 | $13,790 | $1,500 | $12,290 |
| 2014 | $340 | $13,790 | $1,500 | $12,290 |
Source: Public Records
Map
Nearby Homes