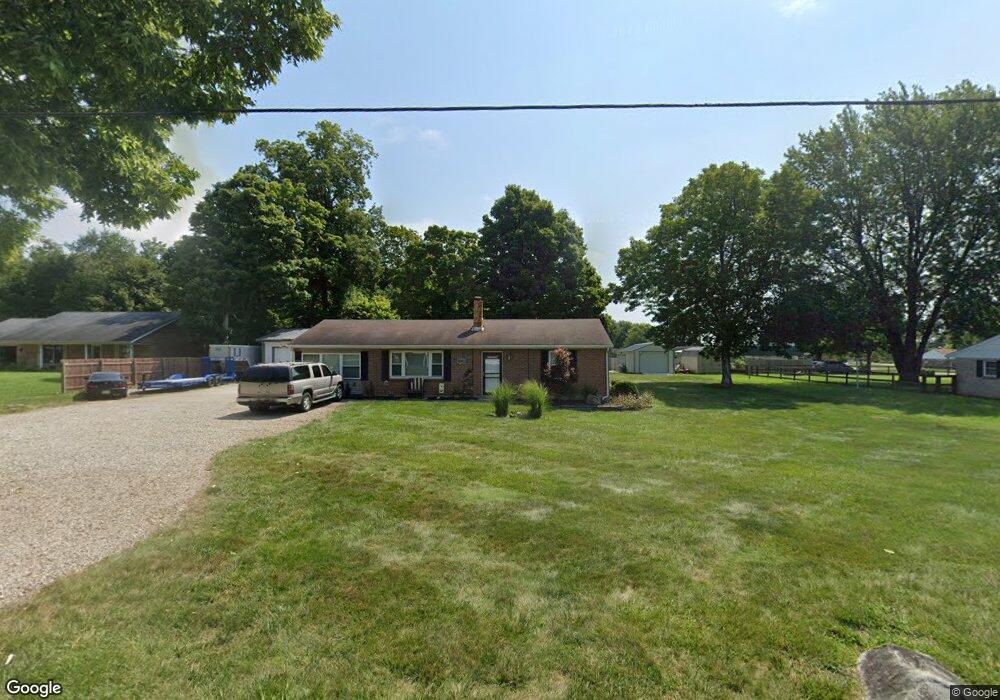
1106 Dafler Rd West Alexandria, OH 45381
Estimated Value: $217,472 - $251,000
3
Beds
1
Bath
1,300
Sq Ft
$178/Sq Ft
Est. Value
About This Home
This home is located at 1106 Dafler Rd, West Alexandria, OH 45381 and is currently estimated at $230,868, approximately $177 per square foot. 1106 Dafler Rd is a home located in Preble County with nearby schools including Twin Valley South Elementary School, Twin Valley South Middle School, and Twin Valley South High School.
Ownership History
Date
Name
Owned For
Owner Type
Purchase Details
Closed on
Sep 1, 2021
Sold by
Yoder Sarah L and Shepherd Alexander M
Bought by
Yoder Sarah L and Shepherd Alexander M
Current Estimated Value
Purchase Details
Closed on
Apr 28, 2010
Sold by
Myers Derrick D and Myers Ashley L
Bought by
Yoder Sarah L and Shepherd Alexander M
Home Financials for this Owner
Home Financials are based on the most recent Mortgage that was taken out on this home.
Original Mortgage
$107,551
Outstanding Balance
$72,790
Interest Rate
5.25%
Mortgage Type
FHA
Estimated Equity
$158,078
Purchase Details
Closed on
May 25, 2007
Sold by
Brubaker Paul A and Brubaker Wilma N
Bought by
Myers Derrick D and Myers Ashley L
Home Financials for this Owner
Home Financials are based on the most recent Mortgage that was taken out on this home.
Original Mortgage
$90,358
Interest Rate
6.27%
Mortgage Type
Seller Take Back
Purchase Details
Closed on
Feb 18, 2003
Sold by
Ankronn James
Bought by
Brubaker Paul A and Brubaker Wilma N
Create a Home Valuation Report for This Property
The Home Valuation Report is an in-depth analysis detailing your home's value as well as a comparison with similar homes in the area
Home Values in the Area
Average Home Value in this Area
Purchase History
| Date | Buyer | Sale Price | Title Company |
|---|---|---|---|
| Yoder Sarah L | -- | None Available | |
| Yoder Sarah L | $163,500 | Attorney | |
| Myers Derrick D | $110,000 | None Available | |
| Brubaker Paul A | $110,000 | -- |
Source: Public Records
Mortgage History
| Date | Status | Borrower | Loan Amount |
|---|---|---|---|
| Open | Yoder Sarah L | $107,551 | |
| Previous Owner | Myers Derrick D | $90,358 |
Source: Public Records
Tax History Compared to Growth
Tax History
| Year | Tax Paid | Tax Assessment Tax Assessment Total Assessment is a certain percentage of the fair market value that is determined by local assessors to be the total taxable value of land and additions on the property. | Land | Improvement |
|---|---|---|---|---|
| 2024 | $1,982 | $56,560 | $7,700 | $48,860 |
| 2023 | $1,982 | $56,560 | $7,700 | $48,860 |
| 2022 | $1,606 | $43,160 | $7,110 | $36,050 |
| 2021 | $1,739 | $43,160 | $7,110 | $36,050 |
| 2020 | $1,666 | $43,160 | $7,110 | $36,050 |
| 2019 | $1,414 | $35,570 | $5,920 | $29,650 |
| 2018 | $1,462 | $35,570 | $5,920 | $29,650 |
| 2017 | $1,366 | $35,570 | $5,920 | $29,650 |
| 2016 | $1,273 | $34,160 | $5,740 | $28,420 |
| 2014 | $1,259 | $34,160 | $5,740 | $28,420 |
| 2013 | $1,393 | $34,965 | $5,740 | $29,225 |
Source: Public Records
Map
Nearby Homes
- 1389 Leon Dr
- 3659 Winston Ln
- 10 Western Dr
- 60 Hope Ave
- 37 Smith St
- 1020 Howard Ct
- 4801 Fisher Twin Rd
- 0 U S 35
- 36 E 3rd St
- 52 E 2nd St
- 212 E 3rd St
- 1148 State Route 503 N
- 0 State Rt 35 Unit 935251
- 6762 U S 35
- 3292 Twin Creek Rd
- 99 Katherine Dr
- 86 Snapdragon Dr
- The Heath House Plan at Meadowbrook Estates
- The Aspen House Plan at Meadowbrook Estates
- The Reed II House Plan at Meadowbrook Estates