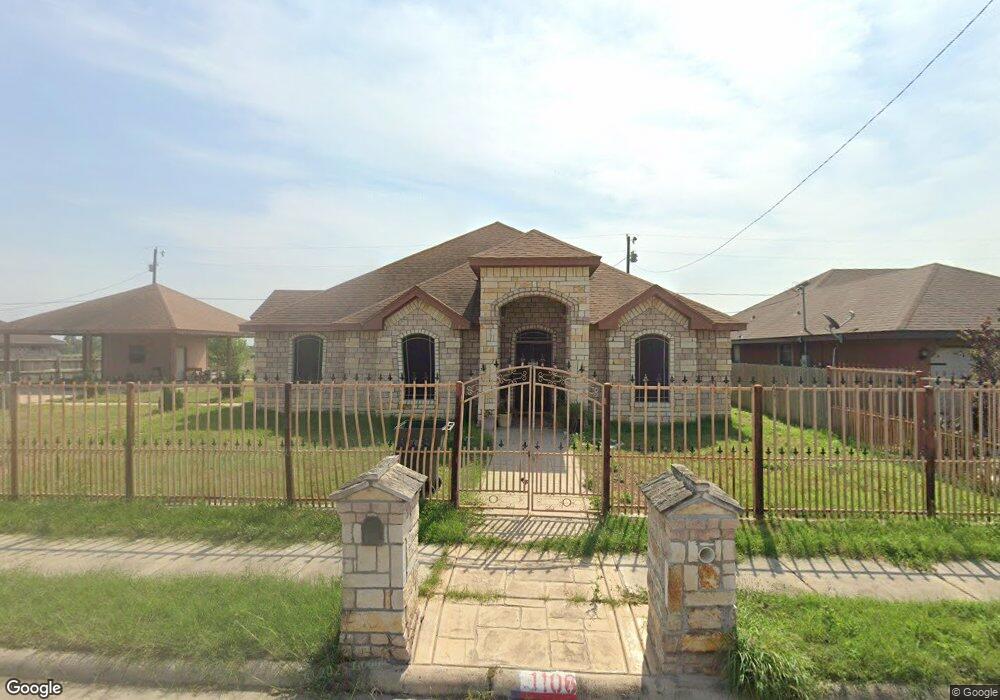
1106 El Sauz St San Juan, TX 78589
Estimated Value: $287,000 - $391,000
3
Beds
2
Baths
2,688
Sq Ft
$128/Sq Ft
Est. Value
About This Home
This home is located at 1106 El Sauz St, San Juan, TX 78589 and is currently estimated at $344,187, approximately $128 per square foot. 1106 El Sauz St is a home with nearby schools including Amanda Garza-Pena Elementary, Raul H. Yzaguirre Middle School, and PSJA Early College High School.
Ownership History
Date
Name
Owned For
Owner Type
Purchase Details
Closed on
Nov 6, 2019
Sold by
Ruiz Rosa Maria
Bought by
Delgado Victor Vazquez
Current Estimated Value
Home Financials for this Owner
Home Financials are based on the most recent Mortgage that was taken out on this home.
Original Mortgage
$225,000
Outstanding Balance
$166,776
Interest Rate
3.65%
Mortgage Type
New Conventional
Estimated Equity
$177,411
Purchase Details
Closed on
Jan 20, 2014
Sold by
Jesus Garza Jose De and Garza Yanira
Bought by
Ruiz Rosa Maria
Purchase Details
Closed on
Sep 8, 2006
Sold by
Fletcher Group Joint Venture #2
Bought by
Garza Jose De Jesus and Garza Yanira
Home Financials for this Owner
Home Financials are based on the most recent Mortgage that was taken out on this home.
Original Mortgage
$16,000
Interest Rate
6.41%
Mortgage Type
Seller Take Back
Create a Home Valuation Report for This Property
The Home Valuation Report is an in-depth analysis detailing your home's value as well as a comparison with similar homes in the area
Home Values in the Area
Average Home Value in this Area
Purchase History
| Date | Buyer | Sale Price | Title Company |
|---|---|---|---|
| Delgado Victor Vazquez | -- | None Available | |
| Ruiz Rosa Maria | -- | None Available | |
| Garza Jose De Jesus | -- | None Available |
Source: Public Records
Mortgage History
| Date | Status | Borrower | Loan Amount |
|---|---|---|---|
| Open | Delgado Victor Vazquez | $225,000 | |
| Previous Owner | Garza Jose De Jesus | $16,000 |
Source: Public Records
Tax History Compared to Growth
Tax History
| Year | Tax Paid | Tax Assessment Tax Assessment Total Assessment is a certain percentage of the fair market value that is determined by local assessors to be the total taxable value of land and additions on the property. | Land | Improvement |
|---|---|---|---|---|
| 2025 | $9,924 | $326,762 | $49,335 | $277,427 |
| 2024 | $9,924 | $383,003 | $89,010 | $293,993 |
| 2023 | $10,296 | $397,661 | $61,824 | $335,837 |
| 2022 | $9,648 | $349,081 | $50,784 | $298,297 |
| 2021 | $7,778 | $275,193 | $57,960 | $217,233 |
| 2020 | $6,365 | $221,422 | $49,680 | $171,742 |
| 2019 | $6,127 | $205,560 | $49,680 | $155,880 |
| 2018 | $5,777 | $192,693 | $35,190 | $157,503 |
| 2017 | $5,864 | $194,317 | $35,190 | $159,127 |
| 2016 | $5,864 | $194,317 | $35,190 | $159,127 |
| 2015 | $1,048 | $35,190 | $35,190 | $0 |
Source: Public Records
Map
Nearby Homes
- 913 Brecha Dr
- 1313 E Evergreen St E
- 904 Gonzalez Dr
- 814 Gomez St
- 408 N Cesar Chavez Rd
- 1322 Washingtonia Palm Ave
- 1100 Washingtonia Palm Ave
- 00 Cesar Chavez Rd
- 1003 Short Rd
- 1200 E Acacia Dr
- 1120 E Acacia Dr
- 1220 E Acacia Dr
- 1204 E Acacia Dr
- 1100 E Acacia Dr
- 1104 E Acacia Dr
- 1124 E Acacia Dr
- 1304 E Acacia Dr
- 1216 E Acacia Dr
- 1107 E Acacia Dr
- 700 E Fm 495
- 1104 El Sauz St
- 1110 El Sauz St
- 1102 El Sauz St
- 916 Brecha St
- 1112 El Sauz St
- 1100 El Sauz St
- 915 Brecha St
- 914 Brecha St
- 916 Sendero St
- 1010 El Sauz St
- 912 Brecha St
- 915 Guadalupe St
- 914 Sendero St
- 1008 El Sauz St
- 910 Brecha St
- 911 Brecha St
- 912 Sendero St
- 920 Guadalupe St
- 911 Guadalupe St
- 917 Sendero St