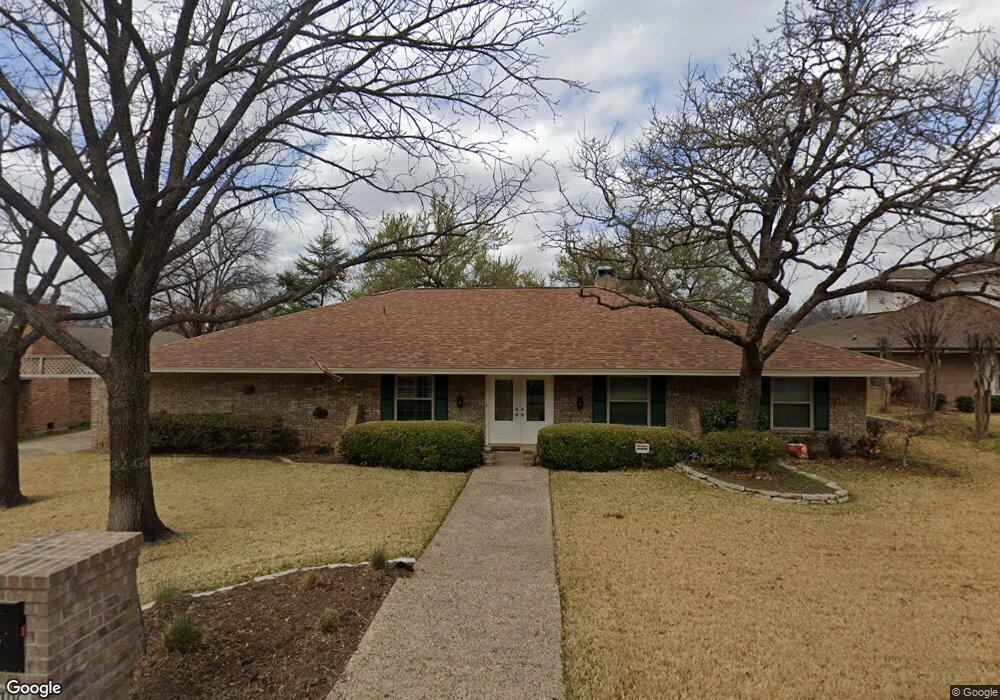
1106 Loch Lomond Ct Arlington, TX 76012
West Arlington NeighborhoodEstimated Value: $429,198 - $513,000
4
Beds
3
Baths
2,558
Sq Ft
$184/Sq Ft
Est. Value
About This Home
This home is located at 1106 Loch Lomond Ct, Arlington, TX 76012 and is currently estimated at $471,050, approximately $184 per square foot. 1106 Loch Lomond Ct is a home located in Tarrant County with nearby schools including Pope Elementary School, Shackelford J High School, and Lamar High School.
Ownership History
Date
Name
Owned For
Owner Type
Purchase Details
Closed on
Jun 21, 2002
Sold by
Walker James M and Walker Robin
Bought by
Kaiser Mark A and Kaiser Gayle P
Current Estimated Value
Home Financials for this Owner
Home Financials are based on the most recent Mortgage that was taken out on this home.
Original Mortgage
$149,600
Outstanding Balance
$63,120
Interest Rate
6.78%
Estimated Equity
$407,930
Purchase Details
Closed on
Jan 16, 1998
Sold by
Walke James M
Bought by
Walker Robin
Home Financials for this Owner
Home Financials are based on the most recent Mortgage that was taken out on this home.
Original Mortgage
$139,774
Interest Rate
7.16%
Purchase Details
Closed on
Mar 29, 1996
Sold by
Lakshmikantham V and Lakshmikantham Sarojamma V
Bought by
Walker James M
Home Financials for this Owner
Home Financials are based on the most recent Mortgage that was taken out on this home.
Original Mortgage
$120,039
Interest Rate
7.35%
Create a Home Valuation Report for This Property
The Home Valuation Report is an in-depth analysis detailing your home's value as well as a comparison with similar homes in the area
Home Values in the Area
Average Home Value in this Area
Purchase History
| Date | Buyer | Sale Price | Title Company |
|---|---|---|---|
| Kaiser Mark A | -- | Alamo Title Company | |
| Walker Robin | -- | Stewart Title | |
| Walker James M | -- | Safeco Land Title |
Source: Public Records
Mortgage History
| Date | Status | Borrower | Loan Amount |
|---|---|---|---|
| Open | Kaiser Mark A | $149,600 | |
| Previous Owner | Walker Robin | $139,774 | |
| Previous Owner | Walker James M | $120,039 | |
| Closed | Walker Robin | $14,316 |
Source: Public Records
Tax History Compared to Growth
Tax History
| Year | Tax Paid | Tax Assessment Tax Assessment Total Assessment is a certain percentage of the fair market value that is determined by local assessors to be the total taxable value of land and additions on the property. | Land | Improvement |
|---|---|---|---|---|
| 2025 | $6,866 | $432,677 | $90,000 | $342,677 |
| 2024 | $6,866 | $432,677 | $90,000 | $342,677 |
| 2023 | $6,340 | $381,003 | $90,000 | $291,003 |
| 2022 | $8,231 | $330,935 | $90,000 | $240,935 |
| 2021 | $7,855 | $302,316 | $80,000 | $222,316 |
| 2020 | $7,476 | $297,704 | $80,000 | $217,704 |
| 2019 | $7,268 | $299,565 | $80,000 | $219,565 |
| 2018 | $5,942 | $254,319 | $40,000 | $214,319 |
| 2017 | $6,153 | $249,481 | $40,000 | $209,481 |
| 2016 | $5,594 | $210,181 | $40,000 | $170,181 |
| 2015 | $4,797 | $209,500 | $40,000 | $169,500 |
| 2014 | $4,797 | $209,500 | $40,000 | $169,500 |
Source: Public Records
Map
Nearby Homes
- 1104 Portofino Ct
- 1420 Porto Bello Ct
- 1006 Portofino Dr
- 1405 Blackhill Ct
- 1103 Findlay Dr
- 905 Live Oak Ln
- 900 Crowley Rd
- 1005 Acorn Ct
- 2804 Oak Cliff Ln
- 809 Valley Oaks Ln
- 2109 Greta Ln
- 1306 Riverview Dr
- 3136 Watercress Cir
- 3107 Watercress Cir
- 3007 Sunray Valley Ct
- 8542 Meadowbrook Dr
- 1529 Woodford Place
- 2308 Westwood Dr
- 606 Setting Sun Ln
- 612 Rainbow Creek Ct
- 1104 Loch Lomond Ct
- 1108 Loch Lomond Ct
- 1115 Crowley Rd
- 1117 Crowley Rd
- 1111 Crowley Rd
- 1107 Loch Lomond Ct
- 1105 Loch Lomond Ct
- 1102 Loch Lomond Ct
- 1110 Loch Lomond Ct
- 1119 Crowley Rd
- 1109 Crowley Rd
- 1111 Loch Lomond Ct
- 1103 Loch Lomond Ct
- 1109 Loch Lomond Ct
- 2910 Lucern Ct
- 1121 Crowley Rd
- 1101 Crowley Rd
- 1105 Crowley Rd
- 1116 Crowley Rd
- 1114 Crowley Rd