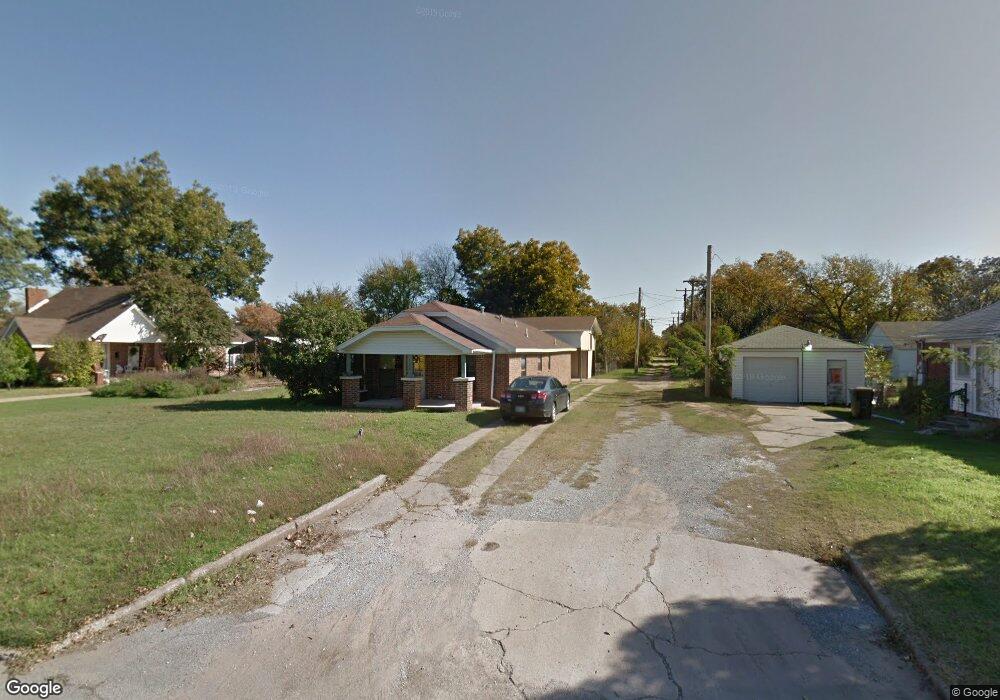
1106 N 10th St Duncan, OK 73533
Estimated Value: $56,000 - $86,000
2
Beds
2
Baths
1,056
Sq Ft
$69/Sq Ft
Est. Value
About This Home
This home is located at 1106 N 10th St, Duncan, OK 73533 and is currently estimated at $72,406, approximately $68 per square foot. 1106 N 10th St is a home located in Stephens County with nearby schools including Emerson Elementary School, Duncan Middle School, and Duncan High School.
Ownership History
Date
Name
Owned For
Owner Type
Purchase Details
Closed on
Oct 7, 2022
Sold by
Alpg Properties Llc
Bought by
Ellis Riley Cade
Current Estimated Value
Purchase Details
Closed on
Mar 30, 2022
Sold by
Wesley Morrow Dakota and Wesley Katie
Bought by
Alpg Properties Llc
Home Financials for this Owner
Home Financials are based on the most recent Mortgage that was taken out on this home.
Original Mortgage
$42,423
Interest Rate
3.63%
Mortgage Type
New Conventional
Purchase Details
Closed on
Jun 19, 2009
Sold by
Davidson Michael and Davidson Rebecca
Bought by
Morrow Dakota W
Home Financials for this Owner
Home Financials are based on the most recent Mortgage that was taken out on this home.
Original Mortgage
$51,075
Interest Rate
4.84%
Mortgage Type
VA
Purchase Details
Closed on
Aug 29, 2002
Sold by
Turner Nancy Kay
Purchase Details
Closed on
May 17, 2001
Sold by
Turner Nancy Kay
Purchase Details
Closed on
Jan 26, 2001
Sold by
Smith Clyde and Smith Pauline
Purchase Details
Closed on
Jun 15, 1990
Create a Home Valuation Report for This Property
The Home Valuation Report is an in-depth analysis detailing your home's value as well as a comparison with similar homes in the area
Home Values in the Area
Average Home Value in this Area
Purchase History
| Date | Buyer | Sale Price | Title Company |
|---|---|---|---|
| Ellis Riley Cade | $105,000 | -- | |
| Ellis Riley Cade | $105,000 | None Listed On Document | |
| Alpg Properties Llc | $41,000 | None Listed On Document | |
| Alpg Properties Llc | $41,000 | None Listed On Document | |
| Morrow Dakota W | $50,000 | Stewart Abstract & Title Of | |
| -- | $41,000 | -- | |
| -- | -- | -- | |
| -- | $38,500 | -- | |
| -- | $3,500 | -- |
Source: Public Records
Mortgage History
| Date | Status | Borrower | Loan Amount |
|---|---|---|---|
| Previous Owner | Alpg Properties Llc | $42,423 | |
| Previous Owner | Morrow Dakota W | $51,075 |
Source: Public Records
Tax History Compared to Growth
Tax History
| Year | Tax Paid | Tax Assessment Tax Assessment Total Assessment is a certain percentage of the fair market value that is determined by local assessors to be the total taxable value of land and additions on the property. | Land | Improvement |
|---|---|---|---|---|
| 2025 | $350 | $4,299 | $376 | $3,923 |
| 2024 | $350 | $4,095 | $376 | $3,719 |
| 2023 | $398 | $4,650 | $376 | $4,274 |
| 2022 | $481 | $5,657 | $376 | $5,281 |
| 2021 | $500 | $5,882 | $376 | $5,506 |
| 2020 | $461 | $5,335 | $376 | $4,959 |
| 2019 | $440 | $5,081 | $376 | $4,705 |
| 2018 | $472 | $5,300 | $376 | $4,924 |
| 2017 | $521 | $6,361 | $376 | $5,985 |
| 2016 | $490 | $5,769 | $376 | $5,393 |
| 2015 | $490 | $5,769 | $376 | $5,393 |
| 2014 | $490 | $5,769 | $376 | $5,393 |
Source: Public Records
Map
Nearby Homes
- 1001 1001 W Hackberry
- 1112 1112 N 12th
- 1444 1444 N 8th St
- 1202 N Grand Blvd
- 1105 1105 N Grand Ave
- 1112 W Spruce St
- 705 705 W Hackberry Ave
- 810 810 N 12th St
- 1114 N 13th St
- 1312 Pkwy
- 1213 W Pine Ave
- 815 N 14th St
- 1112 N 5th St
- 1412 N 12th St
- 812 N 15th St
- 805 805 N 5th
- 1107 W Elk Ave
- 1116 1116 W Chestnut
- 1105 W Beech Ave
- 1402 1402 W Elk Ave
- 1108 N 10th St
- 1104 N 10th St
- 910 Cherry Ave
- 911 W Elder Ave
- 1102 N 10th St
- 909 W Elder Ave
- 904 Cherry Ave
- 907 W Elder Ave
- 1107 N 10th St
- 1109 N 10th St
- 1105 N 10th St
- 1111 N 10th St
- 905 W Elder Ave
- 911 Cherry Ave
- 1113 N 10th St
- 909 Cherry Ave
- 1101 N 10th St
- 2045 N 9th St
- 1115 N 10th St
- 903 W Elder Ave