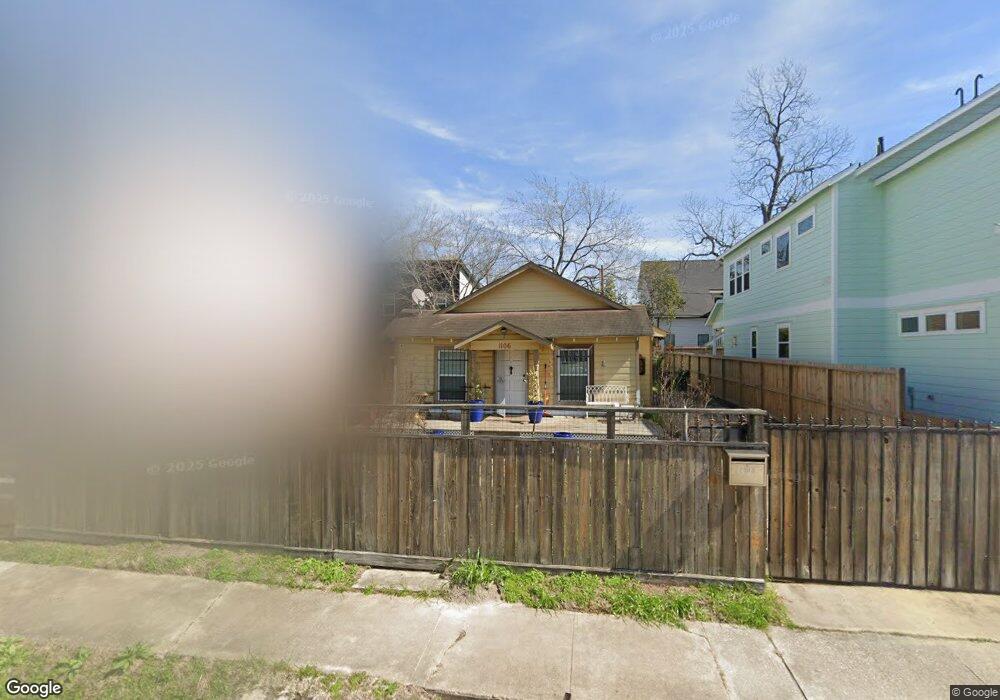
1106 Northwood St Houston, TX 77009
Greater Heights NeighborhoodEstimated Value: $370,858 - $487,000
3
Beds
2
Baths
942
Sq Ft
$442/Sq Ft
Est. Value
About This Home
This home is located at 1106 Northwood St, Houston, TX 77009 and is currently estimated at $416,715, approximately $442 per square foot. 1106 Northwood St is a home located in Harris County with nearby schools including Browning Elementary School, Hogg Middle, and Heights High School.
Ownership History
Date
Name
Owned For
Owner Type
Purchase Details
Closed on
Jul 30, 2025
Sold by
Arroyo Inigo
Bought by
Arroyo Inigo and Arroyo Inigo
Current Estimated Value
Purchase Details
Closed on
May 4, 2024
Sold by
Arroyo Inigo
Bought by
Arroyo Inigo and Arroyo Christopher
Purchase Details
Closed on
Dec 8, 2006
Sold by
Hernandez Edmy Alonso De La Sierra
Bought by
Arroyo Ingio
Purchase Details
Closed on
Apr 23, 2002
Sold by
Kc & W Partnership
Bought by
Arroyo Inigo
Home Financials for this Owner
Home Financials are based on the most recent Mortgage that was taken out on this home.
Original Mortgage
$63,650
Interest Rate
7.09%
Purchase Details
Closed on
Feb 1, 2001
Sold by
Lovell Fred D
Bought by
Kc & W Partnership
Purchase Details
Closed on
Aug 28, 1996
Sold by
Lovell Fred D
Bought by
Lovell Fred D and The Fred D Lovell Revocable Living Trust
Create a Home Valuation Report for This Property
The Home Valuation Report is an in-depth analysis detailing your home's value as well as a comparison with similar homes in the area
Home Values in the Area
Average Home Value in this Area
Purchase History
| Date | Buyer | Sale Price | Title Company |
|---|---|---|---|
| Arroyo Inigo | -- | None Listed On Document | |
| Arroyo Inigo | -- | None Listed On Document | |
| Arroyo Ingio | -- | None Available | |
| Arroyo Inigo | -- | Stewart Title Company | |
| Kc & W Partnership | -- | -- | |
| Lovell Fred D | -- | -- |
Source: Public Records
Mortgage History
| Date | Status | Borrower | Loan Amount |
|---|---|---|---|
| Previous Owner | Arroyo Inigo | $63,650 | |
| Closed | Arroyo Ingio | $0 |
Source: Public Records
Tax History Compared to Growth
Tax History
| Year | Tax Paid | Tax Assessment Tax Assessment Total Assessment is a certain percentage of the fair market value that is determined by local assessors to be the total taxable value of land and additions on the property. | Land | Improvement |
|---|---|---|---|---|
| 2025 | $4,410 | $336,964 | $300,000 | $36,964 |
| 2024 | $4,410 | $331,705 | $300,000 | $31,705 |
| 2023 | $4,410 | $286,145 | $250,000 | $36,145 |
| 2022 | $5,926 | $277,086 | $250,000 | $27,086 |
| 2021 | $5,702 | $274,243 | $250,000 | $24,243 |
| 2020 | $5,386 | $256,557 | $235,000 | $21,557 |
| 2019 | $5,117 | $257,276 | $235,000 | $22,276 |
| 2018 | $3,438 | $247,632 | $225,000 | $22,632 |
| 2017 | $4,225 | $247,632 | $225,000 | $22,632 |
| 2016 | $3,841 | $224,897 | $200,000 | $24,897 |
| 2015 | $2,416 | $199,897 | $175,000 | $24,897 |
| 2014 | $2,416 | $147,467 | $125,000 | $22,467 |
Source: Public Records
Map
Nearby Homes
- 1101 Tabor St
- 1213 Northwood St
- 1209 Tabor St
- 1202 Walton St
- 1718 Redwing Ridge Dr
- 1723 Redwing Ridge Dr
- 910 Coronado St
- 903 Tabor St
- 1311 Walton St
- 1006 Enid St Unit B
- 1707 Redwing Cove Dr
- 808 Coronado St
- 1805 Emir St Unit G
- 1805 Emir St Unit D
- 1805 Emir St Unit L
- 1805 Emir St Unit E
- 738 Redwing Place Dr
- Cordell Street Plan at Cordell Estates
- 1303 Cordell St Unit B
- 1626 Enid St
- 1108 Northwood St
- 1104 Northwood St
- 1102 Northwood St
- 1105 Tabor St
- 1108 E Northwood St W
- 1110 Northwood St
- 1107 Tabor St
- 1103 Tabor St
- 1109 Northwood St
- 1111 Tabor St
- 1012 Northwood St
- 1217 Mathis St
- 1011 Tabor St
- 1201 Northwood St
- 1010 Northwood St
- 1108 Mathis St
- 1106 Tabor St
- 1108 Tabor St
- 1104 Tabor St
- 1110 Mathis St