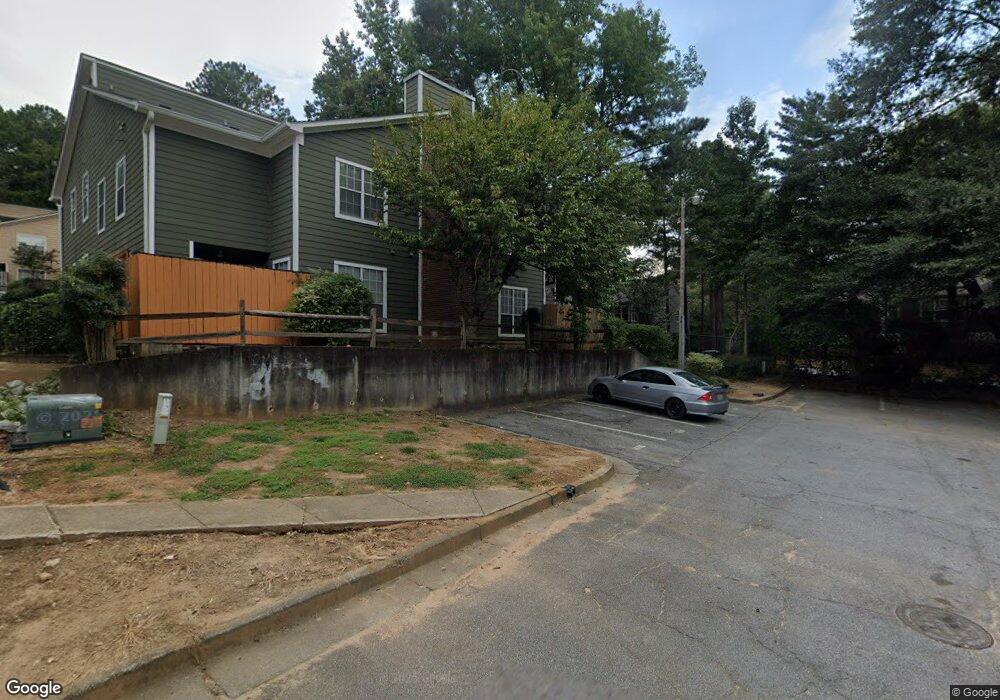
1106 Rock Creek Ln Norcross, GA 30093
Estimated Value: $224,000 - $248,000
3
Beds
3
Baths
1,484
Sq Ft
$163/Sq Ft
Est. Value
About This Home
This home is located at 1106 Rock Creek Ln, Norcross, GA 30093 and is currently estimated at $241,404, approximately $162 per square foot. 1106 Rock Creek Ln is a home located in Gwinnett County with nearby schools including Ferguson Elementary School, Louise Radloff Middle School, and Meadowcreek High School.
Ownership History
Date
Name
Owned For
Owner Type
Purchase Details
Closed on
Jan 4, 2011
Sold by
Hernandez Sandra
Bought by
Hernandez Sandra and Hernandez Luis R S
Current Estimated Value
Purchase Details
Closed on
Sep 7, 2010
Sold by
Citimortgage Inc
Bought by
Federal Natl Mtg Assn Fnma
Purchase Details
Closed on
Jul 14, 2006
Sold by
Hyde Keith
Bought by
Adu Collin and Adu Unis
Home Financials for this Owner
Home Financials are based on the most recent Mortgage that was taken out on this home.
Original Mortgage
$76,407
Interest Rate
6.54%
Mortgage Type
New Conventional
Purchase Details
Closed on
Jan 19, 2000
Sold by
Fatania Mohanlal V and Fatania Maniben M
Bought by
Hyde Keith
Home Financials for this Owner
Home Financials are based on the most recent Mortgage that was taken out on this home.
Original Mortgage
$87,975
Interest Rate
7.9%
Mortgage Type
FHA
Create a Home Valuation Report for This Property
The Home Valuation Report is an in-depth analysis detailing your home's value as well as a comparison with similar homes in the area
Home Values in the Area
Average Home Value in this Area
Purchase History
| Date | Buyer | Sale Price | Title Company |
|---|---|---|---|
| Hernandez Sandra | -- | -- | |
| Hernandez Sandra | -- | -- | |
| Federal Natl Mtg Assn Fnma | -- | -- | |
| Citimortgage Inc | $84,799 | -- | |
| Adu Collin | $95,600 | -- | |
| Hyde Keith | $90,000 | -- |
Source: Public Records
Mortgage History
| Date | Status | Borrower | Loan Amount |
|---|---|---|---|
| Previous Owner | Adu Collin | $76,407 | |
| Previous Owner | Hyde Keith | $90,777 | |
| Previous Owner | Hyde Keith | $87,975 |
Source: Public Records
Tax History Compared to Growth
Tax History
| Year | Tax Paid | Tax Assessment Tax Assessment Total Assessment is a certain percentage of the fair market value that is determined by local assessors to be the total taxable value of land and additions on the property. | Land | Improvement |
|---|---|---|---|---|
| 2024 | $3,606 | $92,720 | $14,000 | $78,720 |
| 2023 | $3,606 | $83,600 | $12,000 | $71,600 |
| 2022 | $2,200 | $68,240 | $8,000 | $60,240 |
| 2021 | $2,231 | $54,360 | $8,000 | $46,360 |
| 2020 | $2,069 | $49,600 | $6,600 | $43,000 |
| 2019 | $1,792 | $43,720 | $6,600 | $37,120 |
| 2018 | $1,557 | $37,160 | $6,600 | $30,560 |
| 2016 | $1,121 | $24,160 | $4,800 | $19,360 |
| 2015 | $974 | $19,680 | $4,000 | $15,680 |
| 2014 | -- | $19,680 | $4,000 | $15,680 |
Source: Public Records
Map
Nearby Homes
- 1068 Dover Way
- 1097 Rock Creek Ln
- 1090 Brittwood Place
- 1066 Rock Creek Ln
- 1089 Brittwood Place
- 1027 Mansfield Ct
- 1037 Dover Way
- 1095 Darby Ct Unit 1095
- 906 Park Forest Dr NW
- 1411 Indian Way NW
- 1110 Falling Water Ln
- 5016 Comanche Ct NW
- 1069 Glasgow Dr NW
- 1060 Heatherwood Ct
- 4608 Rosemear Ct Unit 9
- 1014 Brockdell Ct
- 1360 Dickens Rd NW
- 1067 Mansfield Ct
- 1067 Mansfield Ct
- 1067 Mansfield Ct Unit 1067
- 1034 Wiltshire Way
- 972 Wuthering Way
- 1008 Mansfield Ct
- 1093 Burnside Way Unit 1093
- 1093 Burnside Way
- 1028 Dover Way
- 1087 Mansfield Ct Unit 1087
- 1099 Brittwood Place
- 1077 Dover Way
- 1015 Heathmoor Ct
- 1029 Knights Bridge Ct
- 1045 Rock Creek Ln
- 1078 Dover Way
- 1006 Heathmoor Ct
- 1103 Rock Creek Ln Unit 1103
- 1086 Heathmoor Ct Unit N/A
- 974 Wuthering Way