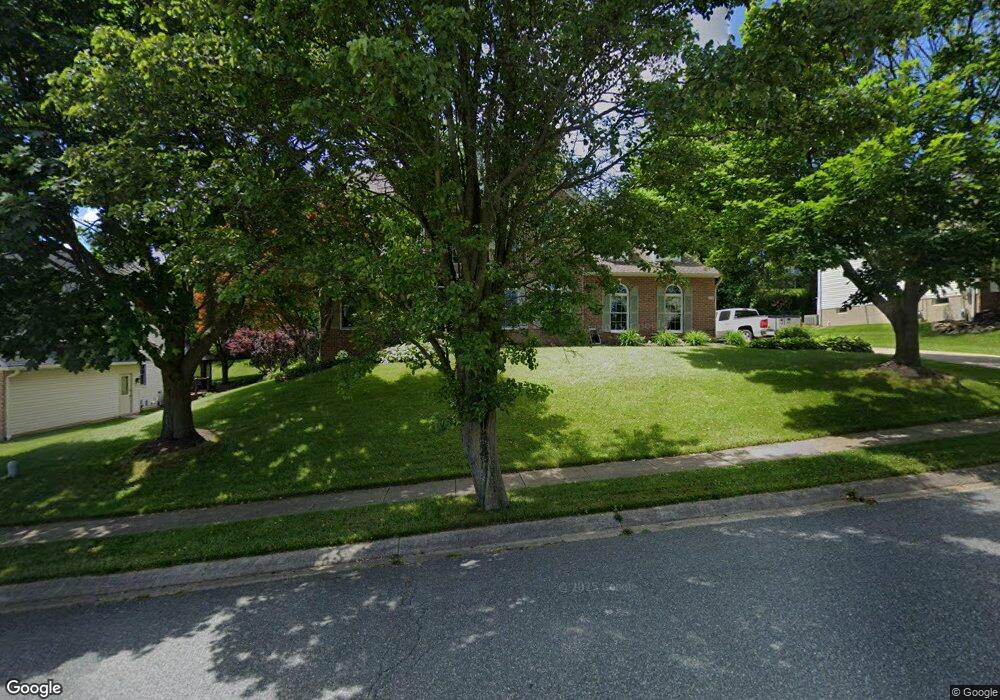
1106 Runnymede Ln Bel Air, MD 21014
Estimated Value: $635,878 - $734,000
--
Bed
3
Baths
2,836
Sq Ft
$243/Sq Ft
Est. Value
About This Home
This home is located at 1106 Runnymede Ln, Bel Air, MD 21014 and is currently estimated at $689,220, approximately $243 per square foot. 1106 Runnymede Ln is a home located in Harford County with nearby schools including Bel Air Elementary School, Southampton Middle School, and C. Milton Wright High School.
Ownership History
Date
Name
Owned For
Owner Type
Purchase Details
Closed on
Dec 10, 2024
Sold by
Chase Donald
Bought by
Chase Donald F and Chase Mary S
Current Estimated Value
Home Financials for this Owner
Home Financials are based on the most recent Mortgage that was taken out on this home.
Original Mortgage
$375,500
Outstanding Balance
$368,612
Interest Rate
6.69%
Mortgage Type
New Conventional
Estimated Equity
$320,608
Purchase Details
Closed on
Aug 24, 2004
Sold by
Gilbert Craig W
Bought by
Chase Donald
Purchase Details
Closed on
Jan 25, 2001
Sold by
Brookman Thomas J
Bought by
Gilbert Craig W and Gilbert Tricia
Purchase Details
Closed on
May 27, 1994
Sold by
Holden Fms Prtnrshp
Bought by
Brookman Thomas J
Home Financials for this Owner
Home Financials are based on the most recent Mortgage that was taken out on this home.
Original Mortgage
$236,500
Interest Rate
8.22%
Create a Home Valuation Report for This Property
The Home Valuation Report is an in-depth analysis detailing your home's value as well as a comparison with similar homes in the area
Home Values in the Area
Average Home Value in this Area
Purchase History
| Date | Buyer | Sale Price | Title Company |
|---|---|---|---|
| Chase Donald F | -- | Getz Title | |
| Chase Donald F | -- | Getz Title | |
| Chase Donald | $425,000 | -- | |
| Gilbert Craig W | $271,000 | -- | |
| Brookman Thomas J | $262,900 | -- |
Source: Public Records
Mortgage History
| Date | Status | Borrower | Loan Amount |
|---|---|---|---|
| Open | Chase Donald F | $375,500 | |
| Closed | Chase Donald F | $375,500 | |
| Previous Owner | Brookman Thomas J | $236,500 | |
| Closed | Gilbert Craig W | -- |
Source: Public Records
Tax History Compared to Growth
Tax History
| Year | Tax Paid | Tax Assessment Tax Assessment Total Assessment is a certain percentage of the fair market value that is determined by local assessors to be the total taxable value of land and additions on the property. | Land | Improvement |
|---|---|---|---|---|
| 2025 | $5,506 | $531,700 | $120,300 | $411,400 |
| 2024 | $5,506 | $505,200 | $0 | $0 |
| 2023 | $5,217 | $478,700 | $0 | $0 |
| 2022 | $4,929 | $452,200 | $120,300 | $331,900 |
| 2021 | $5,171 | $450,167 | $0 | $0 |
| 2020 | $5,171 | $448,133 | $0 | $0 |
| 2019 | $5,148 | $446,100 | $122,600 | $323,500 |
| 2018 | $4,952 | $433,000 | $0 | $0 |
| 2017 | $4,802 | $446,100 | $0 | $0 |
| 2016 | $140 | $406,800 | $0 | $0 |
| 2015 | $4,741 | $405,300 | $0 | $0 |
| 2014 | $4,741 | $403,800 | $0 | $0 |
Source: Public Records
Map
Nearby Homes
- 1403 Bassett Ct
- 1112 Oakwood Ln
- 1006 Diamond Oaks Ct
- 1315 Christopher Ct
- 734 Reedy Cir
- 1808 Oxford Square
- 1247 Athens Ct
- 1223 Athens Ct
- 1220 Athens Ct
- 1700 Conowingo Rd
- 1204 Athens Ct
- 1413 Eagle Ridge Run
- 412 Tyrell Ct
- 927 Redfield Rd
- 1912 Millington Square
- 933 Redfield Rd
- 913 Todd Rd
- 207 Kings Crossing Cir Unit 1C
- 1614 Livingston Dr
- 315 Harlan St
- 1108 Runnymede Ln
- 1104 Runnymede Ln
- 1107 Runnymede Ln
- 1110 Runnymede Ln
- 1102 Runnymede Ln
- 1201 Cheshire Ln
- 1105 Runnymede Ln
- 1101 Sussex Ct
- 1100 Runnymede Ln
- 1112 Runnymede Ln
- 1103 Runnymede Ln
- 1203 Cheshire Ln
- 1100 Sussex Ct
- 1200 Dulwich Ct
- 1200 Cheshire Ln
- 1202 Dulwich Ct
- 1205 Cheshire Ln
- 1201 Dulwich Ct
- 1114 Runnymede Ln
- 1202 Cheshire Ln