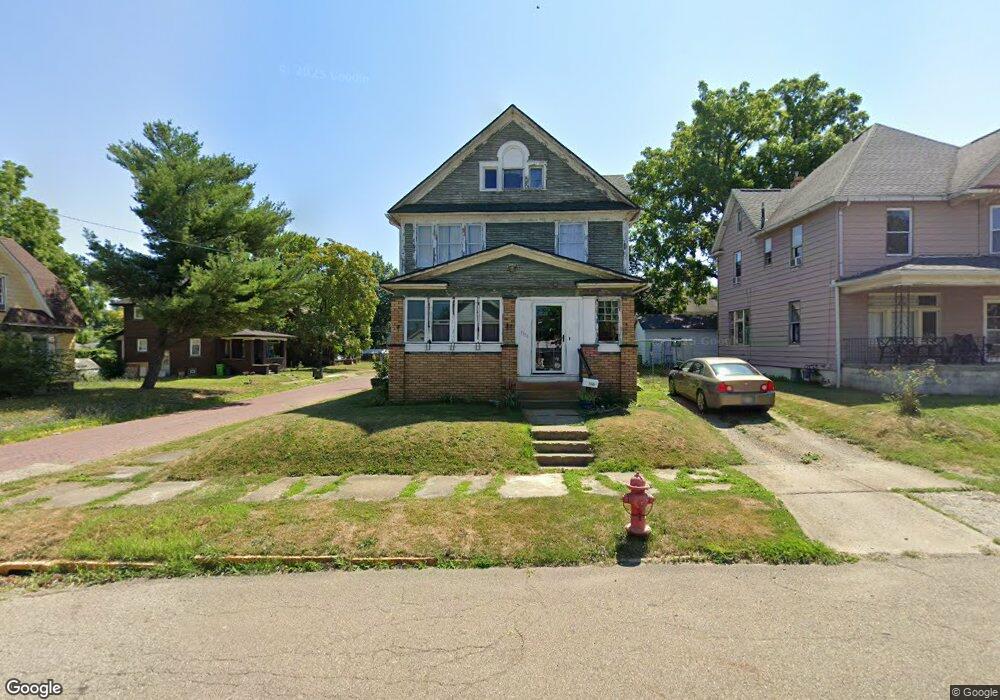
1106 S Linden Ave Alliance, OH 44601
Estimated Value: $64,000 - $90,000
3
Beds
2
Baths
1,500
Sq Ft
$50/Sq Ft
Est. Value
About This Home
This home is located at 1106 S Linden Ave, Alliance, OH 44601 and is currently estimated at $75,022, approximately $50 per square foot. 1106 S Linden Ave is a home located in Stark County with nearby schools including Alliance Elementary School at Rockhill, Alliance Intermediate School at Northside, and Alliance Middle School.
Ownership History
Date
Name
Owned For
Owner Type
Purchase Details
Closed on
Feb 3, 2010
Sold by
Midwest Hone Finders Inc
Bought by
Masters Joseph
Current Estimated Value
Purchase Details
Closed on
Feb 2, 2010
Sold by
Secretary Of Housing & Urban Development
Bought by
Midwest Home Finders Inc
Purchase Details
Closed on
Mar 7, 2009
Sold by
Countrywide Home Loans Inc
Bought by
The Secretary Of Housing & Urban Develop
Purchase Details
Closed on
Mar 4, 2009
Sold by
Omalley Christina A
Bought by
Countrywide Home Loans Inc
Purchase Details
Closed on
Apr 3, 2002
Sold by
Salmen Joanne K
Bought by
Omalley Christina A
Home Financials for this Owner
Home Financials are based on the most recent Mortgage that was taken out on this home.
Original Mortgage
$54,150
Interest Rate
6.87%
Mortgage Type
FHA
Create a Home Valuation Report for This Property
The Home Valuation Report is an in-depth analysis detailing your home's value as well as a comparison with similar homes in the area
Home Values in the Area
Average Home Value in this Area
Purchase History
| Date | Buyer | Sale Price | Title Company |
|---|---|---|---|
| Masters Joseph | $19,000 | None Available | |
| Midwest Home Finders Inc | $2,000 | Attorney | |
| The Secretary Of Housing & Urban Develop | -- | None Available | |
| Countrywide Home Loans Inc | $32,000 | None Available | |
| Omalley Christina A | $55,000 | -- |
Source: Public Records
Mortgage History
| Date | Status | Borrower | Loan Amount |
|---|---|---|---|
| Previous Owner | Omalley Christina A | $54,150 |
Source: Public Records
Tax History Compared to Growth
Tax History
| Year | Tax Paid | Tax Assessment Tax Assessment Total Assessment is a certain percentage of the fair market value that is determined by local assessors to be the total taxable value of land and additions on the property. | Land | Improvement |
|---|---|---|---|---|
| 2025 | $179 | $8,580 | $3,290 | $5,290 |
| 2024 | $159 | $8,580 | $3,290 | $5,290 |
| 2023 | $2,119 | $7,140 | $3,220 | $3,920 |
| 2022 | $289 | $7,140 | $3,220 | $3,920 |
| 2021 | $289 | $7,140 | $3,220 | $3,920 |
| 2020 | $363 | $8,370 | $2,800 | $5,570 |
| 2019 | $358 | $8,370 | $2,800 | $5,570 |
| 2018 | $359 | $8,370 | $2,800 | $5,570 |
| 2017 | $4,627 | $7,290 | $2,350 | $4,940 |
| 2016 | $4,104 | $7,290 | $2,350 | $4,940 |
| 2015 | $340 | $7,290 | $2,350 | $4,940 |
| 2014 | $350 | $7,500 | $2,420 | $5,080 |
| 2013 | $174 | $7,500 | $2,420 | $5,080 |
Source: Public Records
Map
Nearby Homes
- 1005 S Freedom Ave
- 1175 S Freedom Ave
- 551 South St
- 1044 S Liberty Ave
- 1437 S Linden Ave
- 452 E Summit St
- 814 Milner St
- 1475 Chatauqua Ct
- 729 Waugh St
- 1395 S Webb Ave
- 807 S Union Ave
- 815 Grace St
- 831 Wade Ave
- 390 E College St
- 432 S Linden Ave
- 203 Glamorgan St
- 112 E College St
- 1233 Woodland Ave
- 404 S Linden Ave
- 140 W Summit St
- 1116 S Linden Ave
- 0 11th St
- 1042 S Linden Ave
- 1105 Avalon Ave
- 1126 S Linden Ave
- 1115 Avalon Ave
- 420 11th St
- 1121 Avalon Ave
- 1040 S Linden Ave
- 1059 S Linden Ave
- 1134 S Linden Ave
- 438 11th St
- 1133 Avalon Ave
- 1043 S Linden Ave
- 1073 S Linden Ave
- 1022 S Linden Ave
- 1037 S Linden Ave
- 1061 S Linden Ave
- 1113 S Linden Ave
- 1106 Avalon Ave