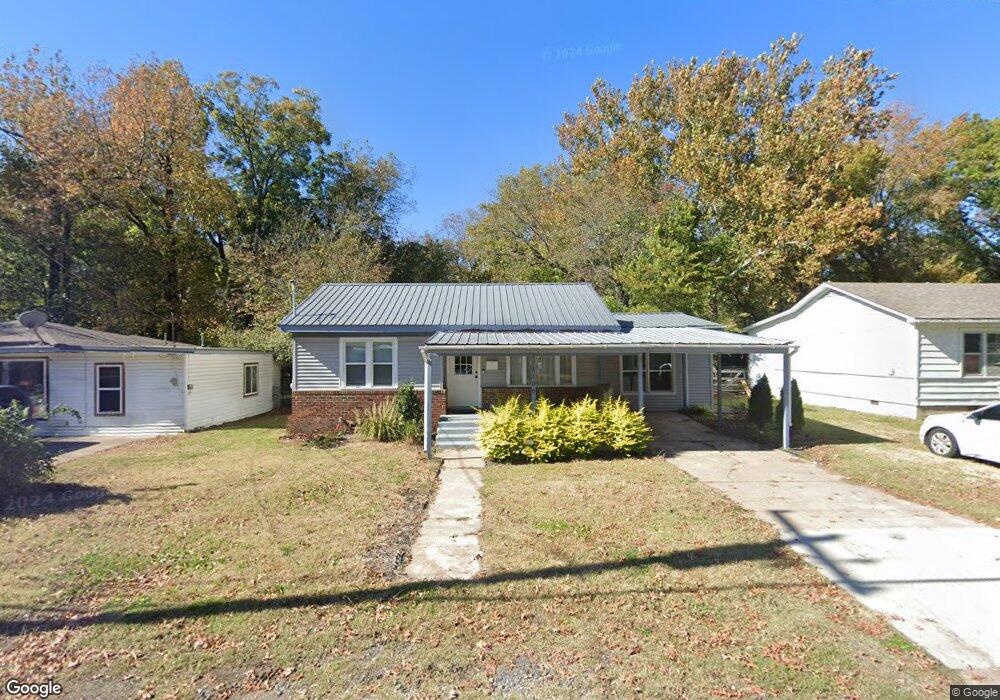
1106 S State Ave Tahlequah, OK 74464
Estimated Value: $155,000 - $177,000
3
Beds
3
Baths
1,330
Sq Ft
$129/Sq Ft
Est. Value
About This Home
This home is located at 1106 S State Ave, Tahlequah, OK 74464 and is currently estimated at $171,344, approximately $128 per square foot. 1106 S State Ave is a home located in Cherokee County with nearby schools including Greenwood Elementary School, Cherokee Elementary School, and Tahlequah Middle School.
Ownership History
Date
Name
Owned For
Owner Type
Purchase Details
Closed on
Aug 30, 2021
Sold by
Parrish Earl Blaine and Pacho Jose
Bought by
Marshall Cheyenne S
Current Estimated Value
Home Financials for this Owner
Home Financials are based on the most recent Mortgage that was taken out on this home.
Original Mortgage
$141,414
Outstanding Balance
$128,200
Interest Rate
2.7%
Mortgage Type
New Conventional
Estimated Equity
$43,144
Purchase Details
Closed on
Apr 9, 2021
Sold by
Adams Thomas C and Adams Judy
Bought by
Parrish Earl Blaine
Purchase Details
Closed on
Apr 8, 2021
Sold by
Adams Steven A and Adams Cheryl
Bought by
Parrish Earl Blaine
Purchase Details
Closed on
Dec 30, 2004
Sold by
James Avery Adams
Bought by
James Avery Adams Trust
Purchase Details
Closed on
Jul 13, 2004
Sold by
Mildred Marie Adams
Bought by
James A Adams
Create a Home Valuation Report for This Property
The Home Valuation Report is an in-depth analysis detailing your home's value as well as a comparison with similar homes in the area
Home Values in the Area
Average Home Value in this Area
Purchase History
| Date | Buyer | Sale Price | Title Company |
|---|---|---|---|
| Marshall Cheyenne S | $139,500 | Infinity Title Llc | |
| Parrish Earl Blaine | $15,000 | None Available | |
| Adams Steven A | -- | None Available | |
| Parrish Earl Blaine | $15,000 | None Available | |
| James Avery Adams Trust | -- | -- | |
| James A Adams | -- | -- |
Source: Public Records
Mortgage History
| Date | Status | Borrower | Loan Amount |
|---|---|---|---|
| Open | Marshall Cheyenne S | $141,414 |
Source: Public Records
Tax History Compared to Growth
Tax History
| Year | Tax Paid | Tax Assessment Tax Assessment Total Assessment is a certain percentage of the fair market value that is determined by local assessors to be the total taxable value of land and additions on the property. | Land | Improvement |
|---|---|---|---|---|
| 2025 | $1,527 | $16,918 | $1,587 | $15,331 |
| 2024 | $1,527 | $16,113 | $1,511 | $14,602 |
| 2023 | $1,527 | $15,345 | $1,049 | $14,296 |
| 2022 | $1,424 | $15,345 | $1,049 | $14,296 |
| 2021 | $493 | $5,292 | $706 | $4,586 |
| 2020 | $478 | $5,040 | $672 | $4,368 |
| 2019 | $451 | $4,800 | $640 | $4,160 |
| 2018 | $435 | $4,571 | $668 | $3,903 |
| 2017 | $413 | $4,354 | $636 | $3,718 |
| 2016 | $396 | $4,147 | $606 | $3,541 |
| 2015 | $354 | $3,950 | $546 | $3,404 |
| 2014 | $354 | $3,761 | $441 | $3,320 |
Source: Public Records
Map
Nearby Homes
- 509 W 2nd St
- 905 Shelley Cir
- 902 S Mission Ave
- 821 S College Ave
- 802 S College Ave
- 1104 Chase Ave
- 757 S Bluff Ave
- 516 W Fox St
- 528 S Muskogee Ave
- 306 Short St
- 513 S State Ave
- 510 S Cherokee Ave
- 1500 Stickross Mountain Rd
- 201 Sandy Cir
- 281 Redbud Ln
- 1025 W Fox St
- 1105 S Maple Ave
- 413 Greenwood Dr
- 14351 U S Highway 62
- 16133 U S Highway 62
- 1104 S State Ave
- 1108 S State Ave
- 404 W 4th St
- 1102 S State Ave
- 1110 S State Ave
- 1100 S State Ave
- 1107 S State Ave
- 1105 S State Ave
- 348 W 4th St
- 1103 S State Ave
- 1008 S State Ave
- 1101 S State Ave
- 1009 S State Ave
- 364 W 4th St
- 403 W 4th St
- 346 W 4th St
- 1006 S State Ave
- 401 W 4th St
- 307 W 4th St
- 405 W 4th St