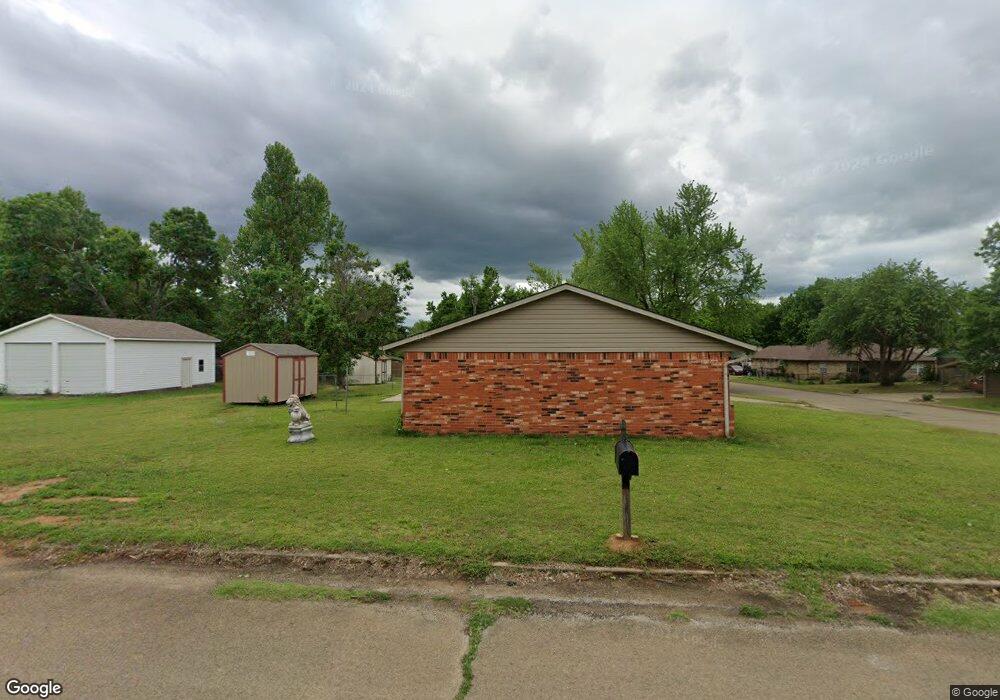
1106 Sharp St Perkins, OK 74059
Estimated Value: $144,000 - $163,000
3
Beds
2
Baths
1,120
Sq Ft
$136/Sq Ft
Est. Value
About This Home
This home is located at 1106 Sharp St, Perkins, OK 74059 and is currently estimated at $152,488, approximately $136 per square foot. 1106 Sharp St is a home located in Payne County with nearby schools including Perkins-Tryon Elementary School, Perkins-Tryon Intermediate Elementary School, and Perkins-Tryon Middle School.
Ownership History
Date
Name
Owned For
Owner Type
Purchase Details
Closed on
Nov 26, 2013
Sold by
Garrison Junior
Bought by
Cimarron Mechanical Inc
Current Estimated Value
Home Financials for this Owner
Home Financials are based on the most recent Mortgage that was taken out on this home.
Original Mortgage
$21,371
Outstanding Balance
$10,800
Interest Rate
4.34%
Mortgage Type
Future Advance Clause Open End Mortgage
Estimated Equity
$141,688
Purchase Details
Closed on
Oct 23, 2013
Sold by
Shaffer Dale W and Lonnie M Houston Revocable Tru
Bought by
Cimarron Mechanical Inc
Home Financials for this Owner
Home Financials are based on the most recent Mortgage that was taken out on this home.
Original Mortgage
$21,371
Outstanding Balance
$10,800
Interest Rate
4.34%
Mortgage Type
Future Advance Clause Open End Mortgage
Estimated Equity
$141,688
Create a Home Valuation Report for This Property
The Home Valuation Report is an in-depth analysis detailing your home's value as well as a comparison with similar homes in the area
Home Values in the Area
Average Home Value in this Area
Purchase History
| Date | Buyer | Sale Price | Title Company |
|---|---|---|---|
| Cimarron Mechanical Inc | $20,000 | Community Escrow & Title | |
| Cimarron Mechanical Inc | $53,500 | None Available |
Source: Public Records
Mortgage History
| Date | Status | Borrower | Loan Amount |
|---|---|---|---|
| Open | Cimarron Mechanical Inc | $21,371 |
Source: Public Records
Tax History
| Year | Tax Paid | Tax Assessment Tax Assessment Total Assessment is a certain percentage of the fair market value that is determined by local assessors to be the total taxable value of land and additions on the property. | Land | Improvement |
|---|---|---|---|---|
| 2025 | $1,540 | $14,083 | $2,061 | $12,022 |
| 2024 | $1,482 | $14,083 | $2,061 | $12,022 |
| 2023 | $1,482 | $13,413 | $1,969 | $11,444 |
| 2022 | $1,396 | $12,774 | $2,137 | $10,637 |
| 2021 | $1,342 | $12,166 | $2,211 | $9,955 |
| 2020 | $1,305 | $11,586 | $1,710 | $9,876 |
| 2019 | $1,332 | $11,587 | $1,710 | $9,877 |
| 2018 | $1,215 | $11,587 | $1,710 | $9,877 |
| 2017 | $1,215 | $11,418 | $1,624 | $9,794 |
| 2016 | $1,004 | $9,562 | $684 | $8,878 |
| 2015 | $924 | $9,562 | $684 | $8,878 |
| 2014 | $950 | $9,562 | $684 | $8,878 |
Source: Public Records
Map
Nearby Homes
- 533 E Kinder Wells Blvd
- 525 E Kinder Wells
- 529 Oak Tree Ave
- 605 Oak Tree Ave
- 14 Cimarron Trail
- 3604 E 116th St
- 1009 NE 3rd St
- 605 E Kinder Wells Blvd
- 19 Cimarron Trail
- 308 Fairway Dr
- 0 W Highway 177 Prime Frontage St Unit Actual address is TB
- 0 W Highway 177 Frontage St Unit Actual address is TB
- 211 E French Ave
- 0 W Highway 33 Frontage St Unit Actual address is TB
- 11312 S Churchill Downs
- 123 W French Ave
- 11306 S Churchill Downs
- 11503 S Churchill Downs
- 11522 Churchill Downs
- 4215 E 122nd St
Your Personal Tour Guide
Ask me questions while you tour the home.