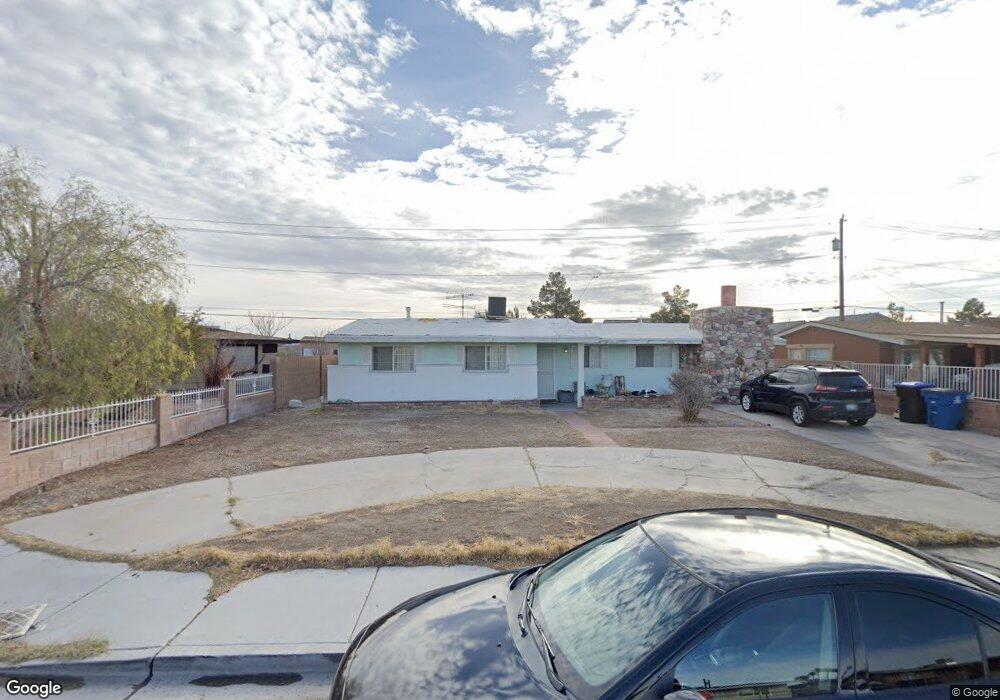
1106 Tamerack Ave Las Vegas, NV 89106
West Las Vegas NeighborhoodEstimated Value: $286,000 - $370,000
3
Beds
2
Baths
1,402
Sq Ft
$240/Sq Ft
Est. Value
About This Home
This home is located at 1106 Tamerack Ave, Las Vegas, NV 89106 and is currently estimated at $336,115, approximately $239 per square foot. 1106 Tamerack Ave is a home located in Clark County with nearby schools including Ollie Detwiler Elementary School, West Prepatory Academy At Charlles I West Hall Sec, and Western High School.
Ownership History
Date
Name
Owned For
Owner Type
Purchase Details
Closed on
Feb 16, 1999
Sold by
Crimp James
Bought by
Crimp Beatrice
Current Estimated Value
Home Financials for this Owner
Home Financials are based on the most recent Mortgage that was taken out on this home.
Original Mortgage
$74,284
Outstanding Balance
$17,643
Interest Rate
6.78%
Mortgage Type
FHA
Estimated Equity
$318,472
Purchase Details
Closed on
May 23, 1996
Sold by
Hansmann George L and Hansmann Pauline
Bought by
Crump James and Crump Beatrice
Home Financials for this Owner
Home Financials are based on the most recent Mortgage that was taken out on this home.
Original Mortgage
$75,562
Interest Rate
7.97%
Mortgage Type
FHA
Purchase Details
Closed on
May 20, 1996
Sold by
Crump James
Bought by
Crump Beatrice
Home Financials for this Owner
Home Financials are based on the most recent Mortgage that was taken out on this home.
Original Mortgage
$75,562
Interest Rate
7.97%
Mortgage Type
FHA
Create a Home Valuation Report for This Property
The Home Valuation Report is an in-depth analysis detailing your home's value as well as a comparison with similar homes in the area
Home Values in the Area
Average Home Value in this Area
Purchase History
| Date | Buyer | Sale Price | Title Company |
|---|---|---|---|
| Crimp Beatrice | -- | Lawyers Title | |
| Crump James | $73,000 | Lawyers Title | |
| Crump Beatrice | -- | Lawyers Title |
Source: Public Records
Mortgage History
| Date | Status | Borrower | Loan Amount |
|---|---|---|---|
| Open | Crimp Beatrice | $74,284 | |
| Closed | Crump Beatrice | $75,562 |
Source: Public Records
Tax History Compared to Growth
Tax History
| Year | Tax Paid | Tax Assessment Tax Assessment Total Assessment is a certain percentage of the fair market value that is determined by local assessors to be the total taxable value of land and additions on the property. | Land | Improvement |
|---|---|---|---|---|
| 2025 | $650 | $48,213 | $29,050 | $19,163 |
| 2024 | $631 | $48,213 | $29,050 | $19,163 |
| 2023 | $1,012 | $48,483 | $31,150 | $17,333 |
| 2022 | $613 | $39,239 | $23,800 | $15,439 |
| 2021 | $595 | $37,135 | $22,750 | $14,385 |
| 2020 | $575 | $32,507 | $18,550 | $13,957 |
| 2019 | $568 | $27,852 | $14,350 | $13,502 |
| 2018 | $542 | $24,906 | $12,250 | $12,656 |
| 2017 | $767 | $23,393 | $10,850 | $12,543 |
| 2016 | $1,012 | $20,855 | $8,750 | $12,105 |
| 2015 | $754 | $16,993 | $5,250 | $11,743 |
| 2014 | $804 | $14,542 | $3,500 | $11,042 |
Source: Public Records
Map
Nearby Homes
- 2624 Feather Cactus Ct
- 1106 Arrowhead Ave
- 1103 Arrowhead Ave
- 2632 Chin Cactus Ct
- 2520 Bottle Palm Ct
- 2625 Chin Cactus Ct
- 2521 Rainbow Cactus Ct
- 1204 Arrowhead Ave
- 913 Jade Plant St
- 1101 Silver Lake Dr
- 2400 Dutchmans Pipe Ct
- 1225 Arrowhead Ave
- 2229 Goldhill Way
- 1700 Ferrell St
- 1604 Luning Dr
- 1313 Purple Sage Ave
- 1112 Hazard Ave
- 3541 Arcadian Sea St
- 2508 Ellingson Dr
- 3494 Alpheus River Ave
- 1104 Tamerack Ave
- 1108 Tamerack Ave
- 1102 Tamerack Ave
- 1107 Tamerack Ave
- 1110 Tamerack Ave
- 2712 Living Rock St
- 2712 Living Rock St Unit None
- 1105 Tamerack Ave
- 2713 Living Rock St
- 2708 Living Rock St
- 1112 Tamerack Ave
- 1100 Tamerack Ave
- 1103 Tamerack Ave
- 2709 Living Rock St
- 2709 Living Rock Ave
- 2712 Wooly Rose Ave
- 1113 Tamerack Ave
- 1114 Tamerack Ave
- 2704 Living Rock St
- 2704 Living Rock Ave