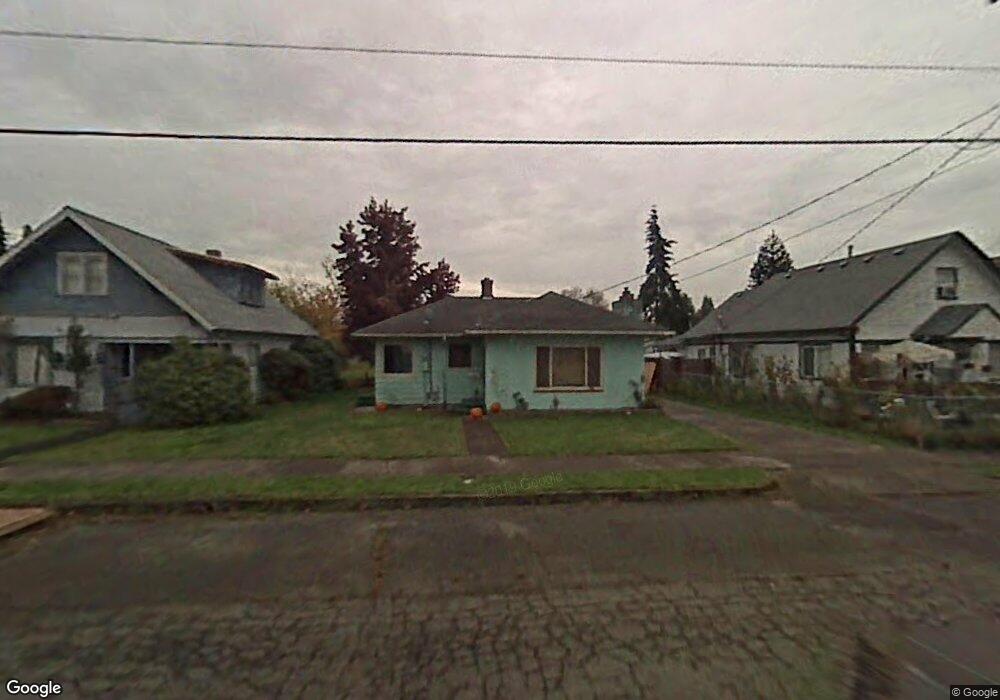
1106 W Main Puyallup, WA 98371
Estimated Value: $403,000 - $462,000
2
Beds
1
Bath
900
Sq Ft
$477/Sq Ft
Est. Value
About This Home
This home is located at 1106 W Main, Puyallup, WA 98371 and is currently estimated at $429,129, approximately $476 per square foot. 1106 W Main is a home located in Pierce County with nearby schools including Maplewood Elementary School, Aylen Junior High School, and Puyallup High School.
Ownership History
Date
Name
Owned For
Owner Type
Purchase Details
Closed on
Aug 19, 2024
Sold by
Mata Mario
Bought by
Mario Mata Trust and Mata
Current Estimated Value
Purchase Details
Closed on
May 11, 1998
Sold by
Breitsprecher Glen Lee
Bought by
Mata Mario and Mata Nazaria R
Home Financials for this Owner
Home Financials are based on the most recent Mortgage that was taken out on this home.
Original Mortgage
$103,272
Interest Rate
7.07%
Mortgage Type
FHA
Create a Home Valuation Report for This Property
The Home Valuation Report is an in-depth analysis detailing your home's value as well as a comparison with similar homes in the area
Home Values in the Area
Average Home Value in this Area
Purchase History
| Date | Buyer | Sale Price | Title Company |
|---|---|---|---|
| Mario Mata Trust | -- | None Listed On Document | |
| Mata Mario | $120,993 | Rainier Title Company |
Source: Public Records
Mortgage History
| Date | Status | Borrower | Loan Amount |
|---|---|---|---|
| Previous Owner | Mata Mario | $103,272 |
Source: Public Records
Tax History Compared to Growth
Tax History
| Year | Tax Paid | Tax Assessment Tax Assessment Total Assessment is a certain percentage of the fair market value that is determined by local assessors to be the total taxable value of land and additions on the property. | Land | Improvement |
|---|---|---|---|---|
| 2025 | $3,586 | $381,900 | $229,500 | $152,400 |
| 2024 | $3,586 | $380,100 | $204,200 | $175,900 |
| 2023 | $3,586 | $356,700 | $188,900 | $167,800 |
| 2022 | $3,564 | $375,400 | $205,500 | $169,900 |
| 2021 | $3,221 | $263,700 | $136,600 | $127,100 |
| 2019 | $2,776 | $244,800 | $123,800 | $121,000 |
| 2018 | $2,823 | $224,200 | $113,500 | $110,700 |
| 2017 | $2,560 | $202,400 | $94,100 | $108,300 |
| 2016 | $2,287 | $160,900 | $70,300 | $90,600 |
| 2014 | $2,065 | $149,200 | $62,000 | $87,200 |
| 2013 | $2,065 | $134,100 | $52,600 | $81,500 |
Source: Public Records
Map
Nearby Homes