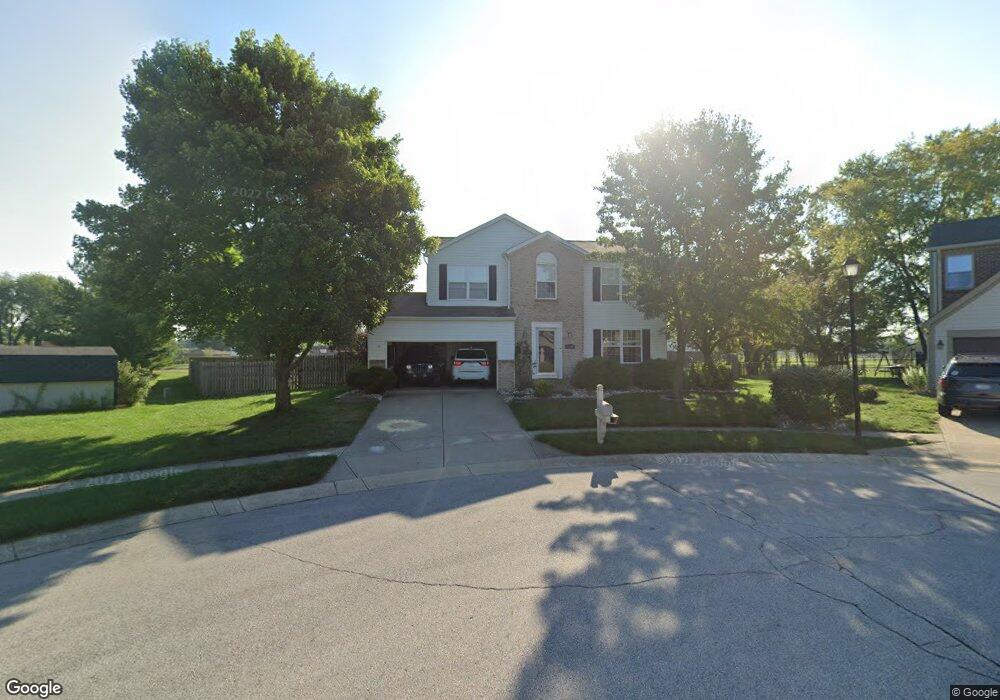
1106 Wyngate Cir Greenwood, IN 46143
Estimated Value: $324,000 - $356,782
4
Beds
4
Baths
2,659
Sq Ft
$129/Sq Ft
Est. Value
About This Home
This home is located at 1106 Wyngate Cir, Greenwood, IN 46143 and is currently estimated at $342,946, approximately $128 per square foot. 1106 Wyngate Cir is a home located in Johnson County with nearby schools including Westwood Elementary School, Greenwood Middle School, and Greenwood Community High School.
Ownership History
Date
Name
Owned For
Owner Type
Purchase Details
Closed on
Sep 28, 2011
Sold by
Weasner Brandon
Bought by
Brandon Brandon G and Brandon Jessica L
Current Estimated Value
Home Financials for this Owner
Home Financials are based on the most recent Mortgage that was taken out on this home.
Original Mortgage
$168,000
Outstanding Balance
$66,702
Interest Rate
4.22%
Mortgage Type
New Conventional
Estimated Equity
$276,244
Purchase Details
Closed on
Dec 7, 2006
Sold by
Sirva Relocation Llc
Bought by
Weasner Brandon
Home Financials for this Owner
Home Financials are based on the most recent Mortgage that was taken out on this home.
Original Mortgage
$173,200
Interest Rate
6.36%
Mortgage Type
New Conventional
Purchase Details
Closed on
Sep 25, 2006
Sold by
Eckman Thomas A and Eckman Patricia A
Bought by
Sirva Relocation Llc
Home Financials for this Owner
Home Financials are based on the most recent Mortgage that was taken out on this home.
Original Mortgage
$173,200
Interest Rate
6.36%
Mortgage Type
New Conventional
Create a Home Valuation Report for This Property
The Home Valuation Report is an in-depth analysis detailing your home's value as well as a comparison with similar homes in the area
Home Values in the Area
Average Home Value in this Area
Purchase History
| Date | Buyer | Sale Price | Title Company |
|---|---|---|---|
| Brandon Brandon G | -- | None Available | |
| Weasner Brandon | -- | None Available | |
| Sirva Relocation Llc | -- | None Available |
Source: Public Records
Mortgage History
| Date | Status | Borrower | Loan Amount |
|---|---|---|---|
| Open | Brandon Brandon G | $168,000 | |
| Previous Owner | Weasner Brandon | $173,200 | |
| Previous Owner | Sirva Relocation Llc | $173,200 |
Source: Public Records
Tax History Compared to Growth
Tax History
| Year | Tax Paid | Tax Assessment Tax Assessment Total Assessment is a certain percentage of the fair market value that is determined by local assessors to be the total taxable value of land and additions on the property. | Land | Improvement |
|---|---|---|---|---|
| 2025 | $2,810 | $308,700 | $63,000 | $245,700 |
| 2024 | $2,810 | $294,300 | $63,000 | $231,300 |
| 2023 | $2,667 | $292,700 | $63,000 | $229,700 |
| 2022 | $2,463 | $258,000 | $50,900 | $207,100 |
| 2021 | $1,778 | $202,600 | $30,600 | $172,000 |
| 2020 | $1,743 | $196,700 | $30,600 | $166,100 |
| 2019 | $1,827 | $202,600 | $23,100 | $179,500 |
| 2018 | $1,574 | $193,600 | $23,100 | $170,500 |
| 2017 | $1,416 | $167,500 | $23,100 | $144,400 |
| 2016 | $1,527 | $167,500 | $23,100 | $144,400 |
| 2014 | $1,341 | $159,100 | $38,100 | $121,000 |
| 2013 | $1,341 | $161,900 | $38,100 | $123,800 |
Source: Public Records
Map
Nearby Homes
- 1117 Sarah Ct
- 1179 Barrington Dr
- 1127 Kay Dr
- 859 Sheffield Dr
- 564 Parkhurst Ct
- 599 Yorktown Rd
- 1216 Thornmeadow Cir
- 1073 Christopher Ct
- 856 Cypress N
- 147 Plymouth Rock Ct
- 771 Burr Oak Dr
- 890 Leatherwood Dr
- 952 Apryl Dr
- Calvin Plan at Brighton Knoll - Designer Collection
- Blair Plan at Brighton Knoll - Designer Collection
- Avery Plan at Brighton Knoll - Designer Collection
- Charles Plan at Brighton Knoll - Designer Collection
- Wyatt Plan at Brighton Knoll - Designer Collection
- Winston Plan at Brighton Knoll - Designer Collection
- Emmett Plan at Brighton Knoll - Designer Collection
- 1100 Wyngate Cir
- 717 Bristol Ct
- 1101 Wyngate Way
- 705 Bristol Ct
- 1101 Wyngate Cir
- 743 S Honey Creek Rd
- 1107 Wyngate Way
- 1107 Wyngate Cir
- 1113 Wyngate Way
- 1113 Wyngate Cir
- 1119 Wyngate Way
- 722 Bristol Ct
- 700 Bristol Ct
- 1119 Wyngate Cir
- 1120 Barrington Dr
- 1114 Barrington Dr
- 1128 Barrington Dr
- 706 Bristol Ct
- 845 Waveland Ln
- 1136 Barrington Dr