Estimated Value: $514,028 - $546,000
Studio
2
Baths
1,898
Sq Ft
$283/Sq Ft
Est. Value
About This Home
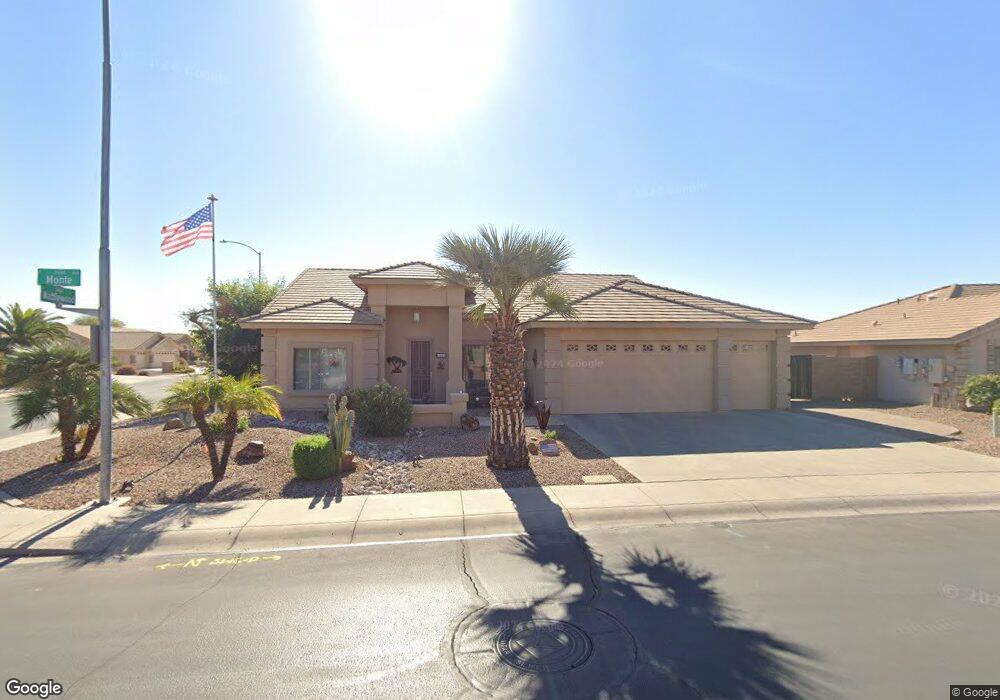
This home is located at 11063 E Monte Ave, Mesa, AZ 85209 and is currently estimated at $536,257, approximately $282 per square foot. 11063 E Monte Ave is a home located in Maricopa County with nearby schools including Augusta Ranch Elementary School, Desert Ridge Jr. High School, and Desert Ridge High School.
Ownership History
Date
Name
Owned For
Owner Type
Purchase Details
Closed on
Jul 7, 2022
Sold by
Fuerstenberg Mark J and Fuerstenberg Cheryl A
Bought by
Fuerstenberg Family Trust
Current Estimated Value
Purchase Details
Closed on
Jan 2, 2007
Sold by
Magnussen Daniel L and Magnussen Margaret E
Bought by
Fuerstenberg Mark J and Fuerstenberg Cheryl A
Home Financials for this Owner
Home Financials are based on the most recent Mortgage that was taken out on this home.
Original Mortgage
$280,000
Interest Rate
6.23%
Mortgage Type
New Conventional
Purchase Details
Closed on
Jun 24, 2005
Sold by
Transnation Title Insurance Co
Bought by
Magnussen Daniel L and Magnussen Margaret E
Home Financials for this Owner
Home Financials are based on the most recent Mortgage that was taken out on this home.
Original Mortgage
$136,000
Interest Rate
5.48%
Mortgage Type
Fannie Mae Freddie Mac
Create a Home Valuation Report for This Property
The Home Valuation Report is an in-depth analysis detailing your home's value as well as a comparison with similar homes in the area
Purchase History
| Date | Buyer | Sale Price | Title Company |
|---|---|---|---|
| Fuerstenberg Family Trust | -- | None Listed On Document | |
| Fuerstenberg Mark J | $350,000 | Transnation Title Ins Co | |
| Magnussen Daniel L | -- | Transnation Title |
Source: Public Records
Mortgage History
| Date | Status | Borrower | Loan Amount |
|---|---|---|---|
| Previous Owner | Fuerstenberg Mark J | $280,000 | |
| Previous Owner | Magnussen Daniel L | $136,000 |
Source: Public Records
Tax History
| Year | Tax Paid | Tax Assessment Tax Assessment Total Assessment is a certain percentage of the fair market value that is determined by local assessors to be the total taxable value of land and additions on the property. | Land | Improvement |
|---|---|---|---|---|
| 2025 | $2,579 | $34,817 | -- | -- |
| 2024 | $2,502 | $33,159 | -- | -- |
| 2023 | $2,502 | $39,420 | $7,880 | $31,540 |
| 2022 | $2,441 | $33,300 | $6,660 | $26,640 |
| 2021 | $2,644 | $31,350 | $6,270 | $25,080 |
| 2020 | $2,598 | $27,280 | $5,450 | $21,830 |
| 2019 | $2,411 | $26,020 | $5,200 | $20,820 |
| 2018 | $2,332 | $25,370 | $5,070 | $20,300 |
| 2017 | $2,259 | $25,130 | $5,020 | $20,110 |
| 2016 | $2,331 | $23,700 | $4,740 | $18,960 |
| 2015 | $2,148 | $23,020 | $4,600 | $18,420 |
Source: Public Records
Map
Nearby Homes
- 2535 S Wattlewood
- 11056 E Neville Ave
- 2635 S Wattlewood
- 11022 E Natal Ave
- 11027 E Natal Ave
- 11009 E Neville Ave
- 11046 E Naranja Ave Unit 5
- 10960 E Monte Ave Unit 266
- 10960 E Monte Ave Unit 248
- 10960 E Monte Ave Unit 238
- 10960 E Monte Ave Unit 198
- 10960 E Monte Ave Unit 229
- 10960 E Monte Ave Unit 195
- 2660 S Tambor
- 2723 S Wattlewood
- 11259 E Medina Ave
- 11242 E Medina Ave
- 11322 E Neville Ave Unit 3
- 2730 S Willow Wood
- 11337 E Mendoza Ave
- 11057 E Monte Ave
- 11064 E Natal Ave
- 11058 E Natal Ave
- 11062 E Monte Ave
- 2605 S Wattlewood
- 11051 E Monte Ave
- 2565 S Wattlewood
- 2611 S Wattlewood
- 11056 E Monte Ave
- 11052 E Natal Ave
- 2617 S Wattlewood
- 11050 E Monte Ave
- 11045 E Monte Ave
- 11059 E Natal Ave
- 11065 E Natal Ave
- 11046 E Natal Ave
- 11053 E Natal Ave
- 2551 S Wattlewood
- 11049 E Natal Ave
- 2623 S Wattlewood
Your Personal Tour Guide
Ask me questions while you tour the home.